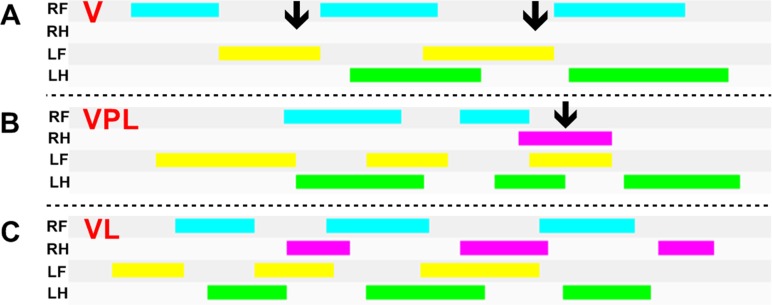
Fig 4. Timing diagrams: duration of pathway contact for a given paw in V, VPL and VL groups.
(A) Representative illustration of mice feet prints registered during walking by the CatWalk system at 3 hours after Bothrops jararacussu venom (Bjssu) injection, (B) Bjssu injection treated with placebo laser and (C) Bjssu injection followed by GaAs laser irradiation. The paw-pathway contacts for each of the four paws over time are indicated. The length of each bar represents the duration of the stand phase for that particular paw. The space between bars represents the duration of the swing phase. The absence of the stand phase (A) as well its delay (B) in the use of the injured limb (RH—pink bars) is observed in V and VPL groups (arrows). The panel (C) shows a pattern of VL feet prints, which did not differ significantly from the baseline print registered 24 h before Bjssu nor from the S, SL and SPL prints (not shown), and hence consistent with a normal gait. RF = right frontlimb, RH = right hindlimb, LF = left frontlimb, LH = left hindlimb.

