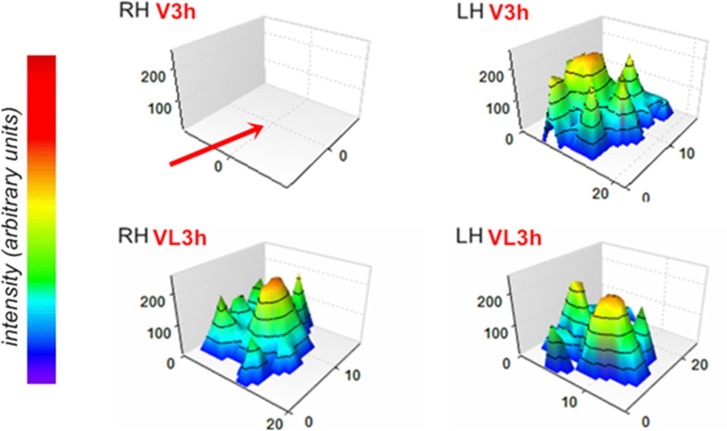
Fig 5. Intensity according pressure performed by the paws.
3D graphics showing zero pressure intensity for the right hindlimb (RH–red arrow) and the relative intensity of the fingers of LH (left hindlimb), characterizing the gait pattern mostly related to group V animals (and VLP not shown) at 3 h after Bjssu injection (upper left and right graphics). The lower, left and right graphics illustrate the normal pressure intensity of the RH and LH of mice that had been i.m.-injected with Bjssu and submitted to LLLT, hence characterizing regular gait pattern of VL-3 h mice, and which did not differ from the observed in the S-, SL- and SPL-3 h groups or 24 h before Bjssu injection (not shown).

