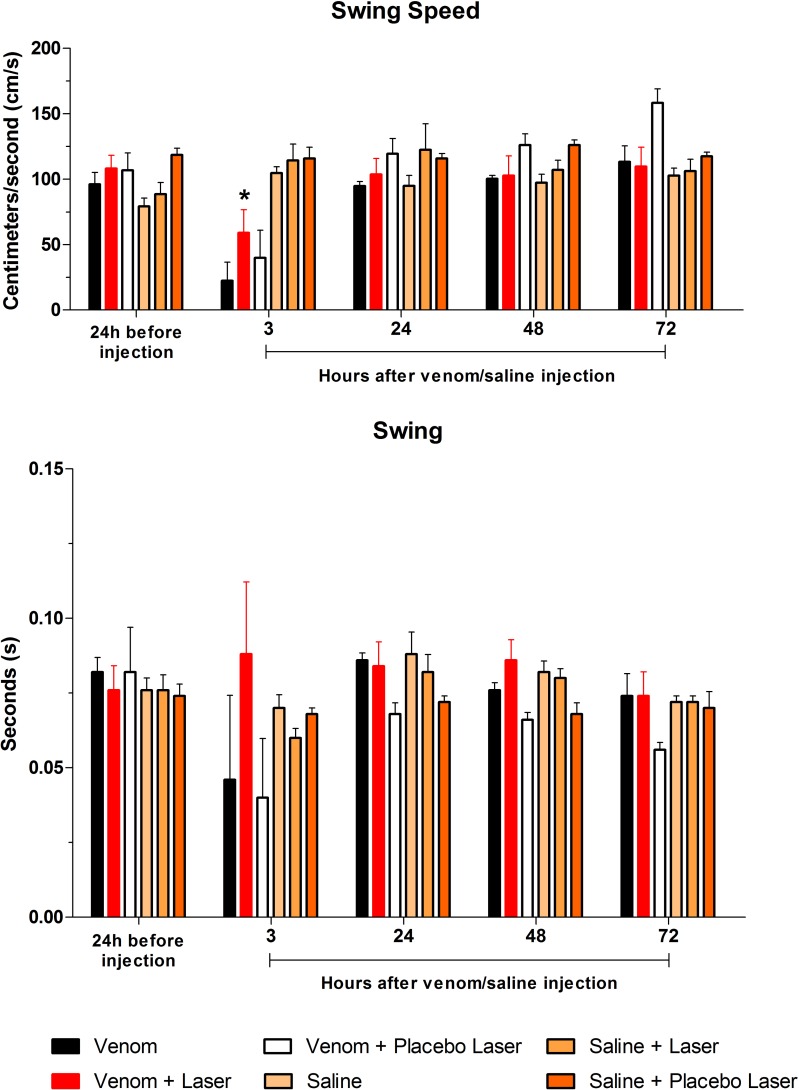
Fig 7. Bar graphs showing Swing Speed and Swing.
In both parameters difference (p*<0.05) was observed at 3h post-injection, mean for Swing Speed of V and VPL groups. The laser treated group (VL–red bar) showed no significant difference compared to baseline and the post Bjssu injection periods for the Swing parameter. Data are expressed as mean +/- SD; statistical analysis were performed by One-way ANOVA followed by Tukey's Multiple Comparison test; (*) when the group VL is different from V and VPL (p*<0.05) in the same period.

