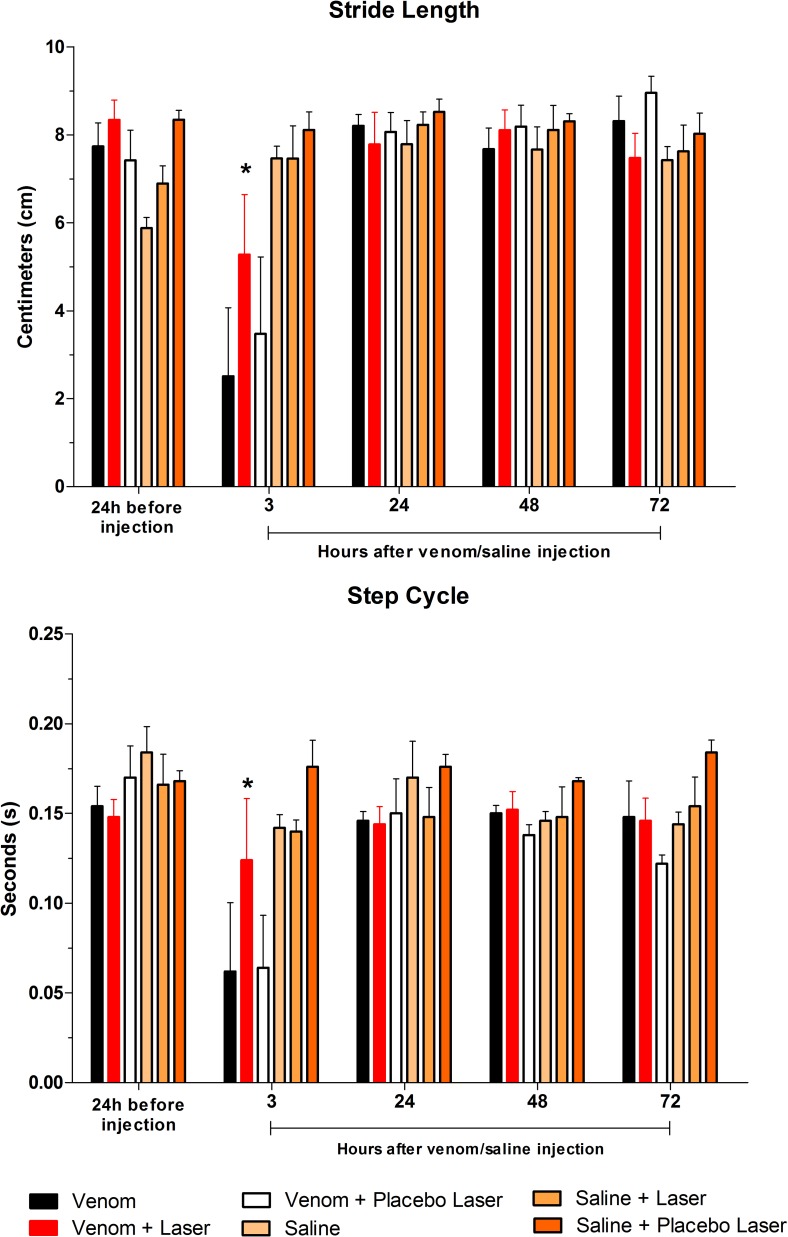
Fig 8. Bar graphs showing Stride Length and Step Cycle.
The period of 3 hours following Bjssu injection was critical for V and VPL groups, like in the previous parameters. The laser treated group (VL–red bar) showed no difference compared to baseline and post-injection periods for both parameters, but was different from V-3 h and VPL-3 h in the same period. Data are expressed as mean +/- SD; statistical analysis were performed by One-way ANOVA followed by Tukey's Multiple Comparison test; (*) when the group VL is different from V and VPL (p*<0.05) in the same period.

