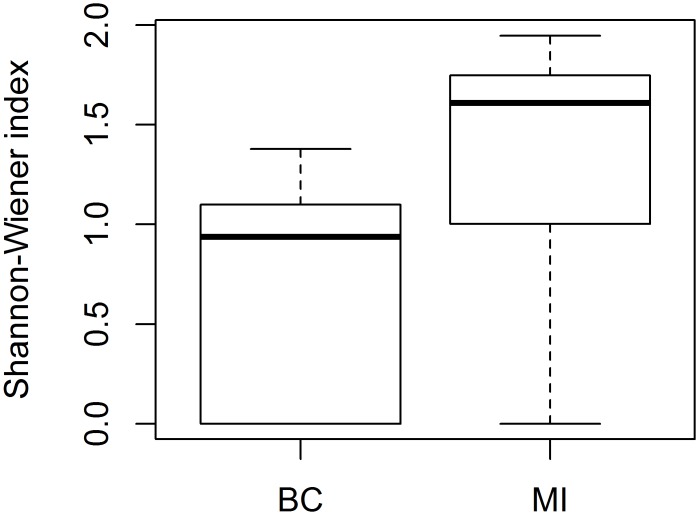
Fig 5. Shannon-Wiener diversity of blueberry visiting bees across regions.
Field-based Shannon-Wiener diversity of bees for British Columbia (BC) and Michigan (MI). Boxplots are based on Shannon-Wiener diversity measures for each field. Boxes represent the inter-quartile range (25th to 75th percentile). The line represents the median and whiskers are the furthest data points within 1.5 times the inter-quartile range.

