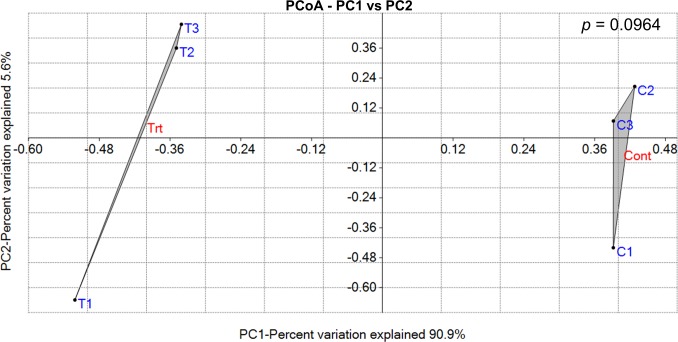
Fig 5. Principal Coordinate Analysis (PCoA) illustrating distances between bacterial communities identified from control (C1-C3) and NaCl-treated roots (T1-T3) of Caliph medic.
The pairwise comparison using the ANOSIM test did not show significant variation (p = 0.0964) between the community groups identified from control plants (Cont) and NaCl plants (Trt). The first two coordinates explained about 96% while the third coordinate explained only 2.3% of the variation.

