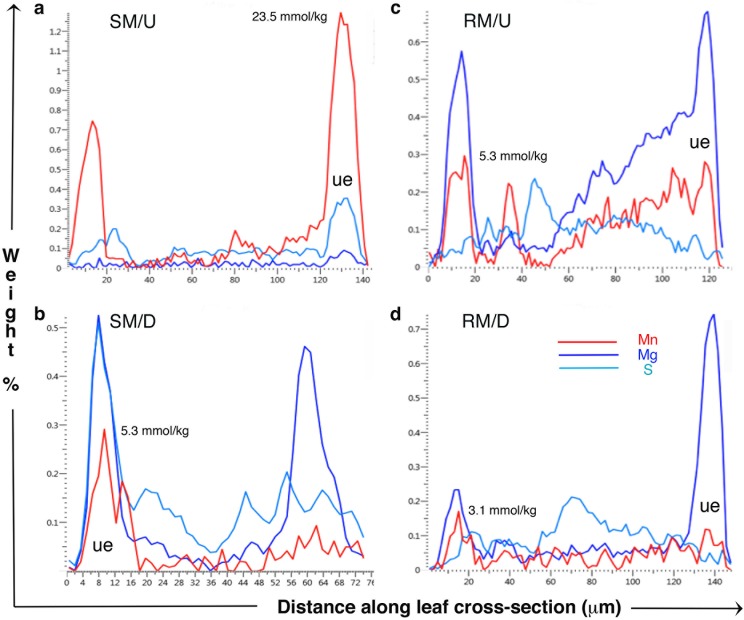
Fig 5. X-ray intensity profiles for Mn, Mg and S along transect lines taken through leaf cross sections as depicted in the SEM images corresponding to frames a, b, c, and d in Figs 1–4.
Data are collected to the lateral boundaries marked on either side of the central line. For the largest Mn peak in each frame, weight % Mn concentrations have been converted to mmol/kg as a guide. Notation: ue = upper epidermis.

