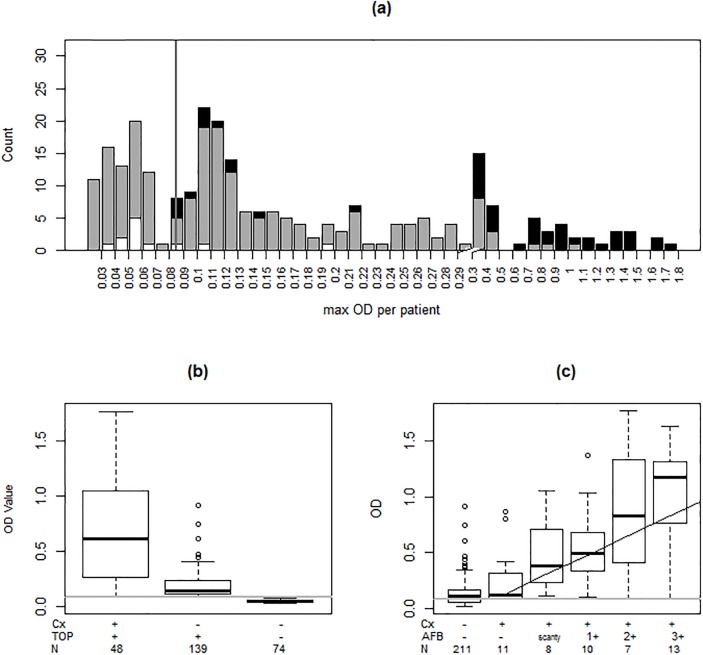
Fig 2. TOP TB assay results in 261 HIV-infected TB suspects from Mbarara, Uganda.
(a) Vertical line denotes the laboratory cut-off TOP OD (0.0854) for a positive test. Histograms represent the number of subjects with culture-positive (black), culture-contaminated (white) and culture-negative (grey) results, by TOP OD values. The X-axis is zoomed-in at the lower end of TOP OD values (0.100 to 0.300) to show the large number of subjects in this section of the graph. (b) Group TOP OD values according to culture (Cx) and TOP results (group means are 0.67, 0.19, and 0.05, from left to right). The mean TOP OD of culture-positive/TOP-positive (0.67) samples was higher than in culture-negative/TOP-positive (0.19, P<0.0001), suggesting a low bacterial load content in many HIV-infected TB suspects. (c) Median TOP ODs paralleled sputum AFB grades (P<0.0001), demonstrating the semi-quantitative performance of the TOP TB assay. One subject with a scanty AFB reading and a contaminated culture was excluded (TOP OD 0.103). A smoothing spline fit to the data is shown.

