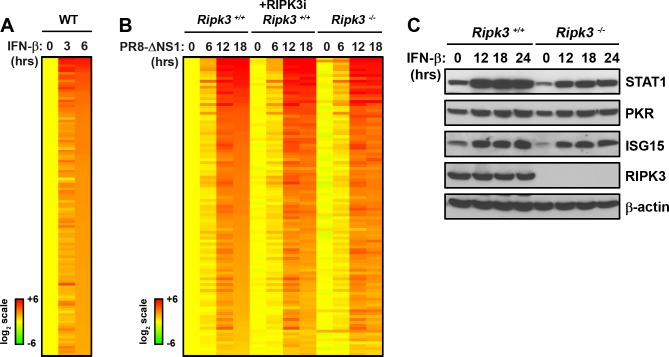
Fig 4. Normal IFN-β signaling in the absence of RIPK3.
(A) Heatmap showing expression profiles of genes upregulated by IFN-β in WT MEFs. Expression levels in untreated cells were normalized to one (20, yellow), and genes demonstrating 4-fold or more induction at 6 h were considered induced and sorted based on fold-induction at 6 h. Heat bars shown to the left represent relative expression levels on a log2 scale. (B) Heatmap displaying the behavior of IFN responsive genes in ripk3+/+ MEFs (column 1–4), ripk3+/+ MEFs treated with RIPK3 inhibitor (GSK’872 at 5μM, column 5–8), or ripk3-/- MEFs (column 9–12) following PR8-ΔNS1 infection. Expression levels in mock infected in ripk3+/+ MEFs were normalized to one (20, yellow) and genes displaying at least two-fold changes at 18 h were considered IAV regulated. Genes are sorted based on fold-induction at 18 h in ripk3+/+ MEFs. No genes were found to be dependent on RIPK3. (C) Levels of ISG-encoded proteins were compared in ripk3+/+ and ripk3-/- MEFs by immunoblot analysis following treatment with IFN-β (1000U/mL) for the indicated times.

