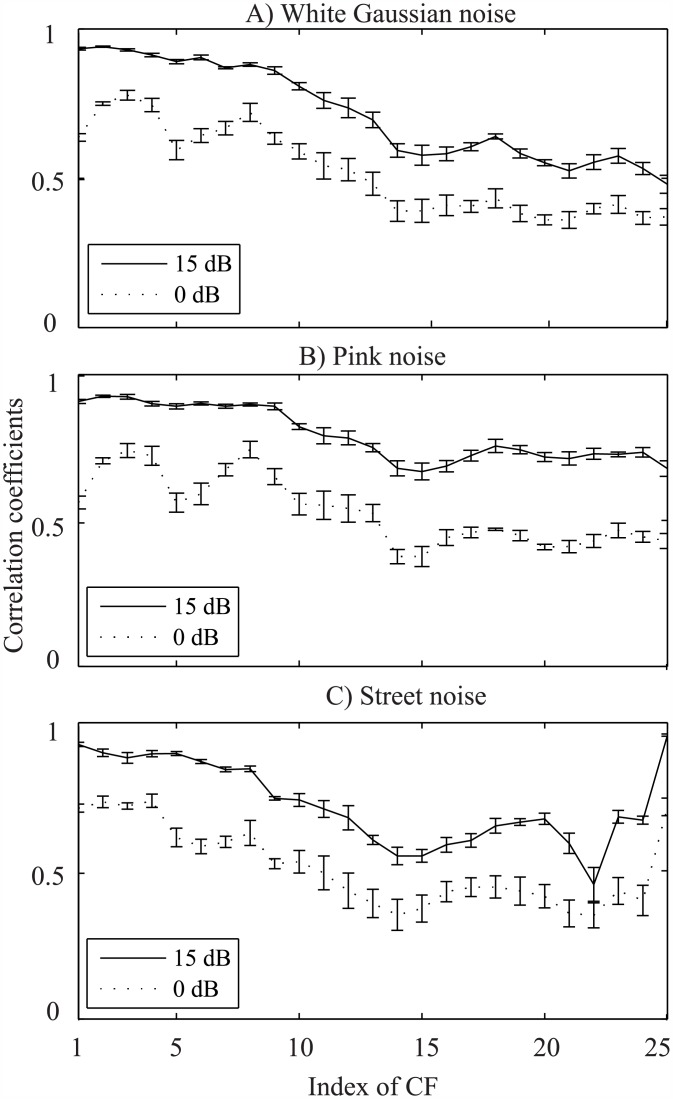
Fig 4. Illustration of the effects of noise on the neural responses.
Neural responses were simulated to five clean speech signals taken from the YOHO database and to the corresponding noisy signals for SNRs of 0 and 15 dB with three types of noise: white Gaussian noise, pink and street noise. The correlation coefficients were calculated between the clean and the corresponding noisy signals for each CF, and the results are shown for 25 CFs (up to a phase-locking range of ~4 kHz). Panel A shows the mean and standard deviation of the correlation coefficients calculated for white Gaussian noise, and the corresponding results for pink and street noise are shown in panel B and C, respectively.

