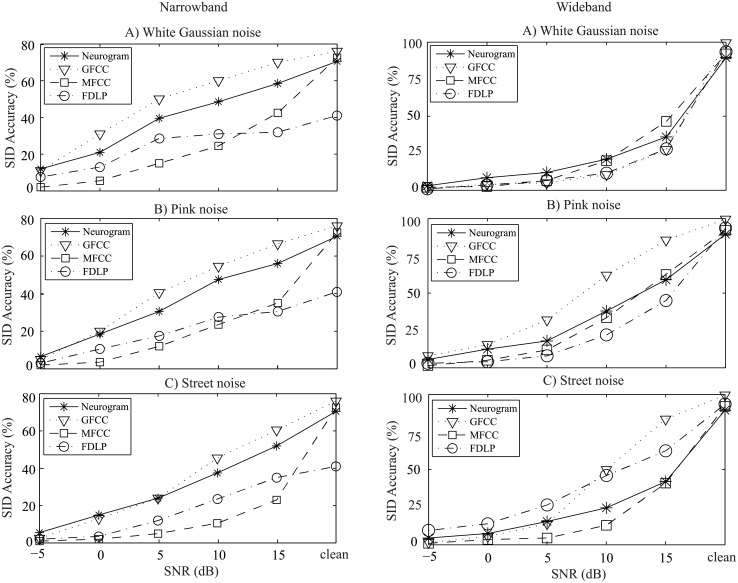
Fig 6. Speaker identification performance of the proposed and existing methods using the TIMIT database.
Left panels: Performance is shown for features corresponding to frequencies ~<1 kHz; right panels: features corresponding to the full range of frequencies (up to ~4 kHz) are considered for SI evaluation. Results are shown as a function of SNR with three different types of noise (A: white Gaussian noise, B: pink noise, and C: street noise). Speech samples from 100 speakers were used for evaluation and comparison of the performance of different methods.

