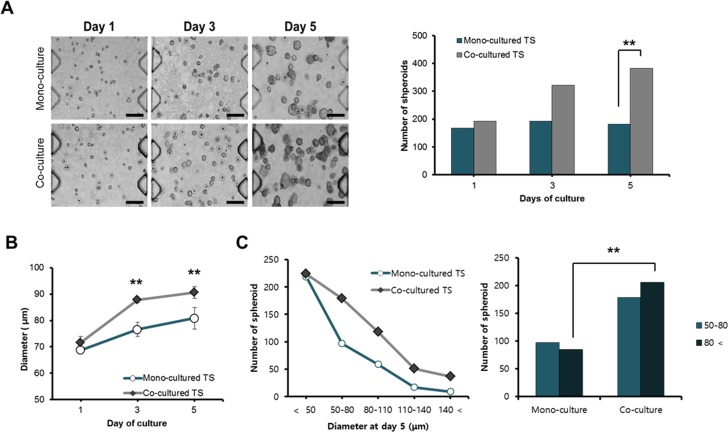
Fig 3. Effect of co-culture on growth and size distribution of spheroids.
Cells were grown in collagen-supported microfluidic channels with or without fibroblast co-cultures and number and size distribution was determined at day 5. (A) Growth of HT-29 spheroids in size and number (scale bar = 200 μm). (B) Comparison of mean diameter of HT-29 spheroids over 5 days. (C) Comparison of size distribution of tumor spheroids on day 5. Diameter of spheroids was calculated using bright field images and Image J program. Cell aggregates of diameter larger than 50 μm were considered as spheroids. Student t-test as well as χ2 test were used for the statistical significance. Data are expressed as the mean ± SE of 3 replicates. * p<0.05, **p<0.01.

