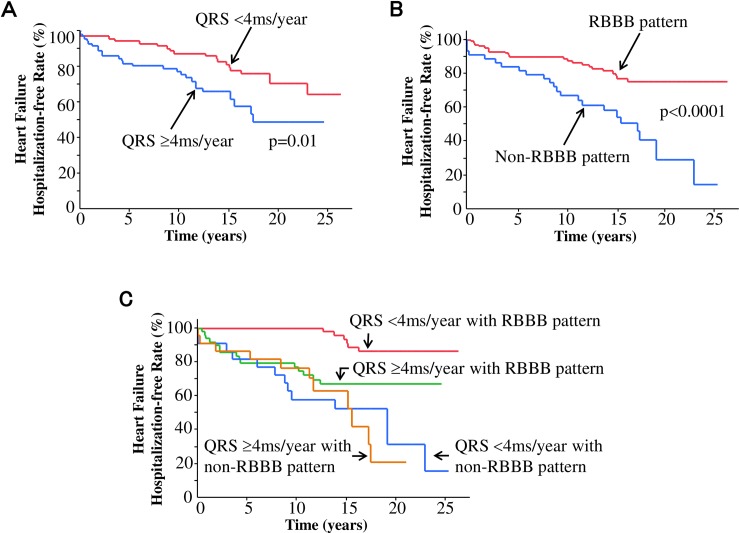
Fig 1. Kaplan-Meier survival analysis for hospitalization for heart failure.
(A) Temporal increase in QRS duration of <4ms/year (red line) versus ≥4 ms/year (blue line). (B) Development of a right bundle branch block (RBBB) pattern (red line) versus a non-RBBB [i.e., left bundle branch block (LBBB), RBBB with left anterior hemiblock, or non-specific intraventricular conduction disturbance (NSIVCD)] pattern (blue line). (C) Classification into four groups based on the temporal increase in QRS duration and the development of BBB patterns: patients with the temporal increase in QRS duration of <4 ms/year and the development of an RBBB pattern (red line), patients with the temporal increase in QRS duration of ≥4 ms/year and the development of an RBBB pattern (green line), patients with the temporal increase in QRS duration of <4 ms/year and the development of a non-RBBB pattern (blue line), and patients with the temporal increase in QRS duration of ≥4 ms/year and e development of a non-RBBB pattern.

