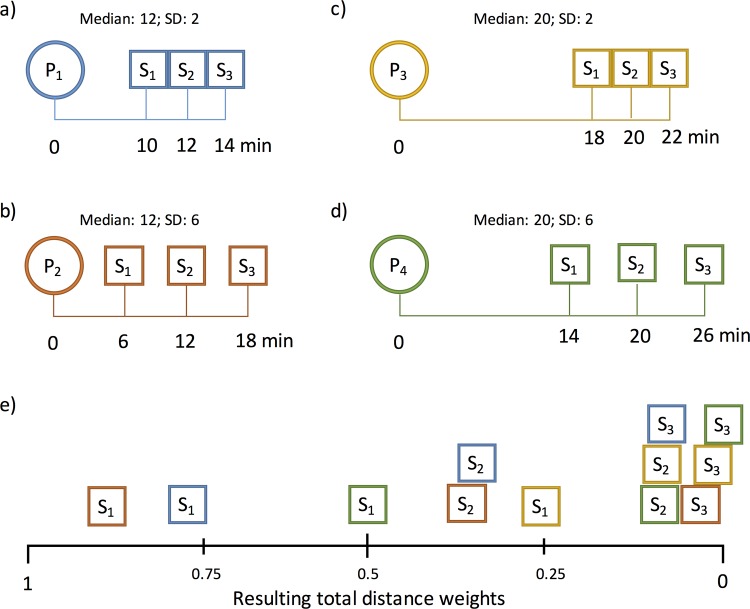
Fig 2.
Four configurations (a-d) of population locations (P1-4) and three provider locations (S1-3) within a 30min global catchment. e) shows the resulting total distance weight for distances between population and providers (see matching colours). Distances are for illustration purposes only and hence not true to scale.

