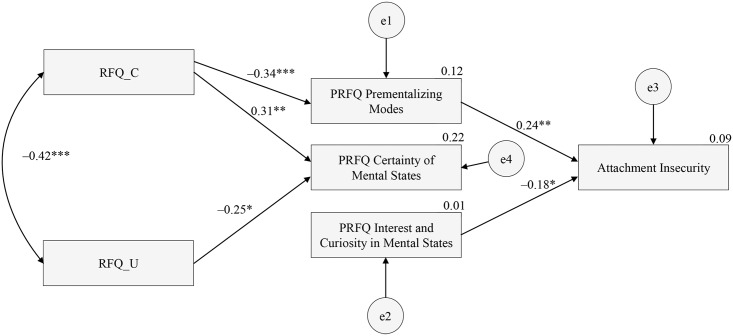
Fig 2. Final model for the relationships between the RFQ, PRFQ, and infant attachment status as assessed in the SSP.
Rectangles indicate measured variables and the small circles reflect residuals (e). Bidirectional arrow depicts covariance and unidirectional arrows depict hypothesized directional links. *p<0.05, **p<0.01, ***p<0.001.

