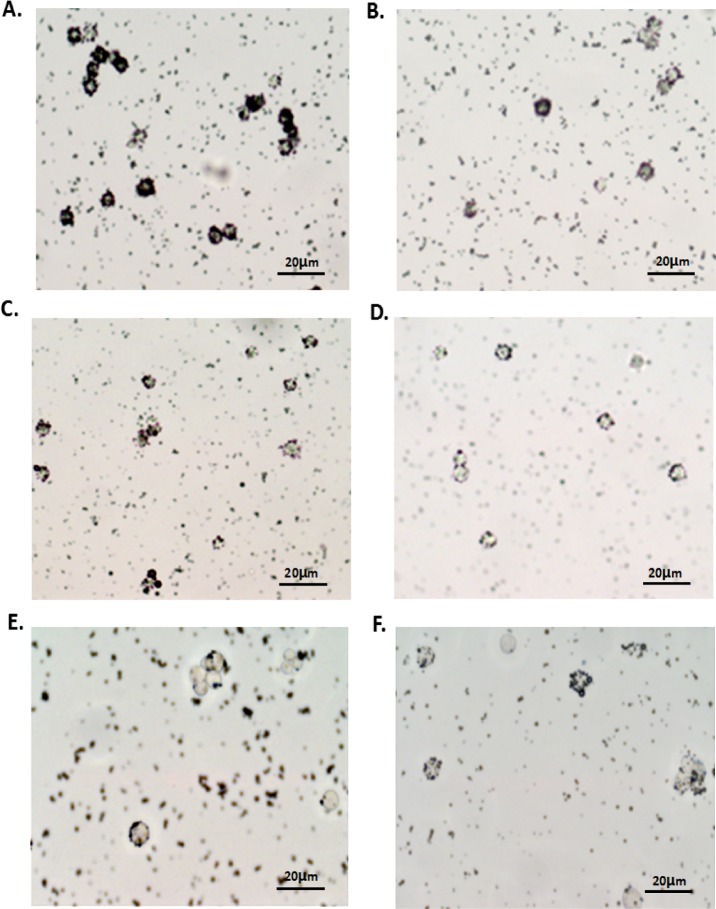
Fig 3. Target-searching image in vitro (400×).
(A, C) Light microscope image of specific binding in the targeted group; (B, D) light microscope image of binding in the non-targeted group. (E, F) light microscope image of binding after using anti-αvβ3 monoclonal antibody. Each photo is representative of three experiments.

