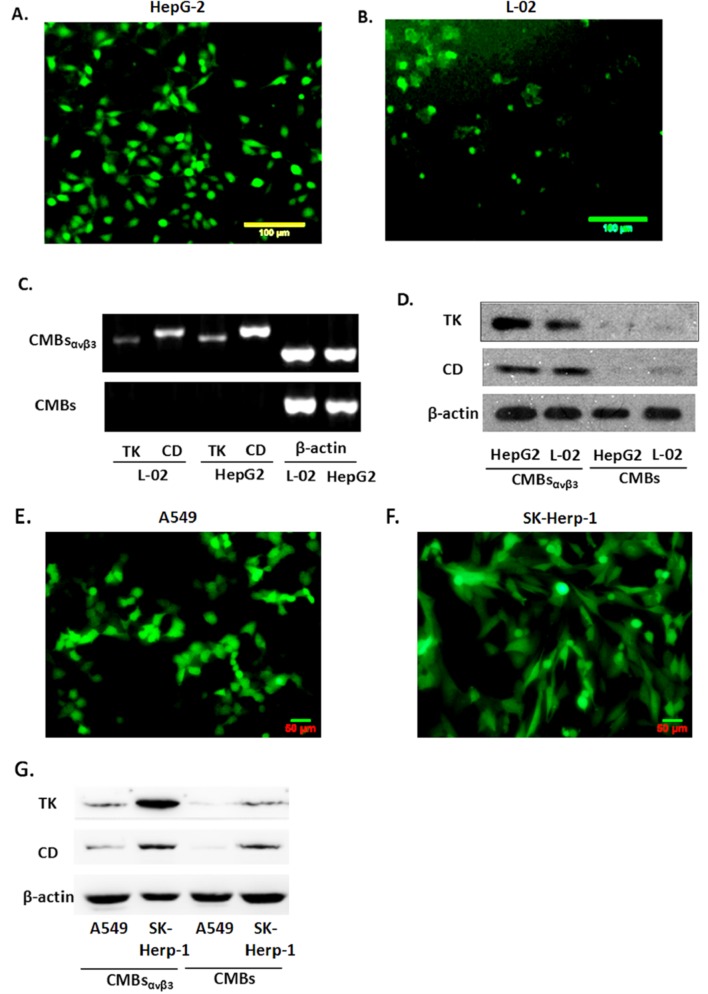
Fig 4. Transfection efficiency of CMBsαvβ3 and Expression of CD/TK in HepG2 and L-02 cells.
A and B. EGFP expression levels in HepG2 cells (A) and L-02 cells (B) were detected using fluorescence. 10 visions were chosen at random and each experiment was repeated for three times (mean ± SD of three experiments). C. mRNA expression of the target gene CD/TK in HepG2 and L-02 cells was evaluated by RT-PCR. Bands at 381bp (CD) and 355bp (TK) were observed in all groups of both HepG2 and L-02 cells. Each photo is representative of three experiments. D. Protein expression level of CD/TK in HepG2 and L-02 cells. Lane1:L02; Lane2:HepG2; Lane3: L02+CD/TK; Lane4:HepG2+CD/TK. Each photo is representative of three experiments. E and F. EGFP expression levels in A549 cells (E) and SK-Herp-1 cells (F) were detected using fluorescence. 10 visions were chosen at random and each experiment was repeated for three times (mean ± SD of three experiments). G. Protein expression level of CD/TK in A549 and Ssk-Herp-1 cells. Each photo is representative of three experiments.

