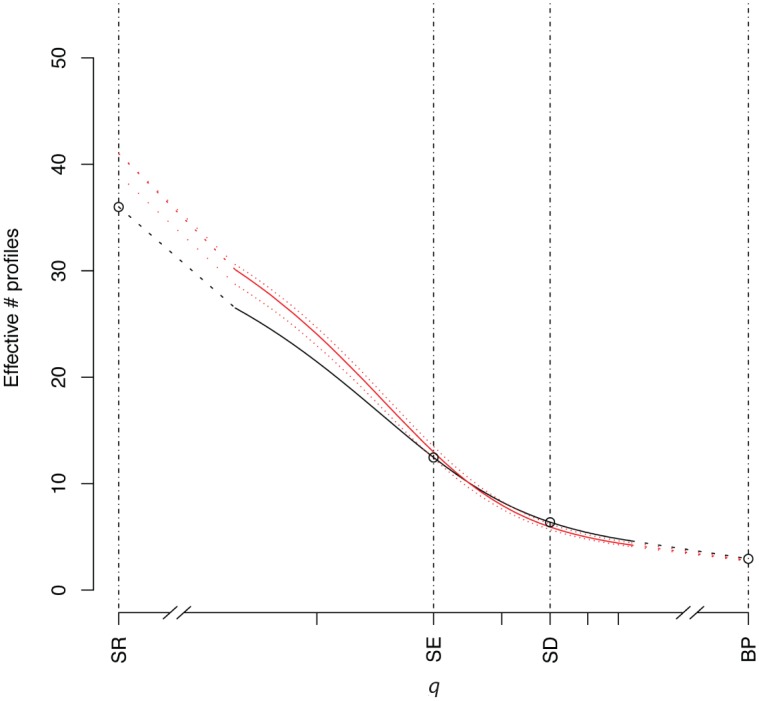
Fig 1. Observed ecological diversities of the swine S. Typhimurium var. 5- AMR profiles for all values of the q parameter, including Species richness [SR], Shannon entropy [SE], Simpson diversity [SD], Berger-Parker [BP] for passive surveillance (red) and active surveillance (black) isolates with confidence intervals (dotted lines) for the passive surveillance sample generated by subsampling to the size of the active surveillance sample.

