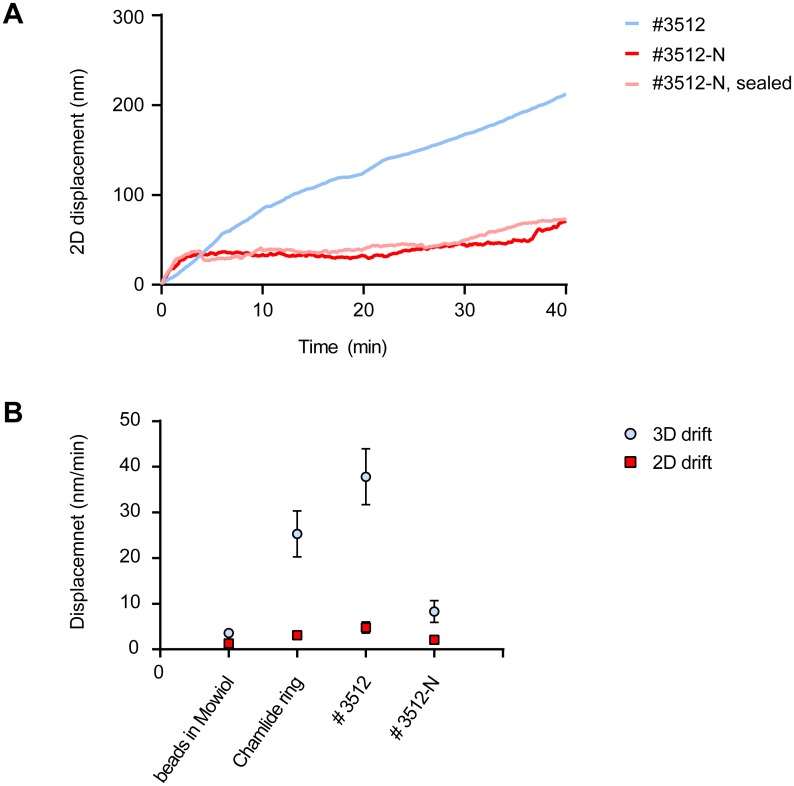
Fig 6. Optimizing drift in SR preparations.
(A) Example traces of drift quantifications during 30 min in #3512 dishes (blue), #3512-N dishes (red) and #3512-N dishes sealed with coverslip and adhesive-backed aluminum tape (pink). Shown is the mean displacement away from the origin of immobilized beads during 30 min. (B) Summary of 2D (lateral; square symbols) and 3D (lateral + focus, round symbols) drift experiments. Shown are endpoint drifts at 30 min and at 60 min for the indicated imaging dishes. The WillCo Wells optimized #3512-N dishes display significantly improved stability. Data are mean +/- SEM of >3 experiments each.

