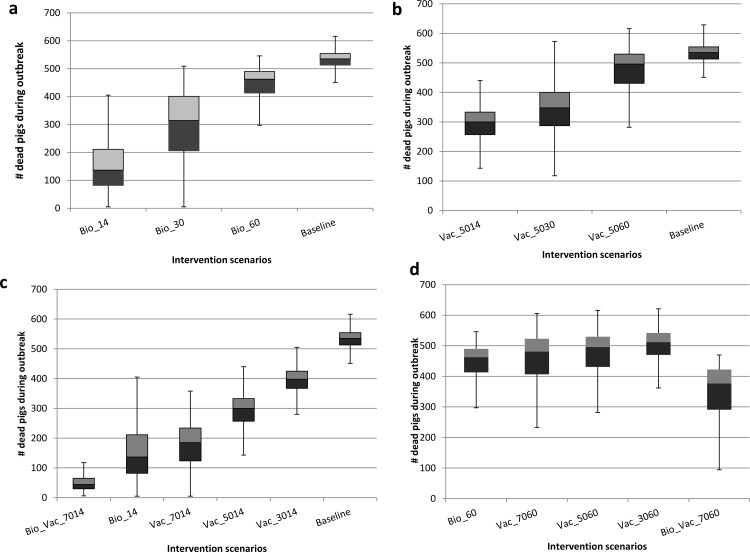
Fig 2. Box plots showing the effect of timing of introduction of different intervention scenarios on disease burden.
The baseline box represents an intervention-free scenario. Panel (a) shows the effect of the timing of introduction of biosecurity measures after the onset of the epidemic (where Bio_xx = Biosecurity strategy implemented at day xx). Panel (b) depicts effects of vaccination (protecting 50%) implemented at day 14, 30 and 60 days on disease burden (i.e. Vac_50xx = Vaccination conferring 50% protection at day xx). Panel (c) compares the effects of different vaccine efficacies and a combination intervention strategy on disease burden when intervention is started at day 14 (Bio_Vac_7014 = Combination of biosecurity and 70% Vaccine efficacy implemented at day 14). Panel (d) depicts the effects of delayed intervention on disease burden across different strategies of vaccine efficacies and combination scenarios (i.e. Vac_yyxx = Pulse Vaccination of efficacy yy% implemented at day xx while Bio_Vac_7060 is a combination strategy of Biosecurity measures and 70% efficacy vaccine implemented at day 60).

