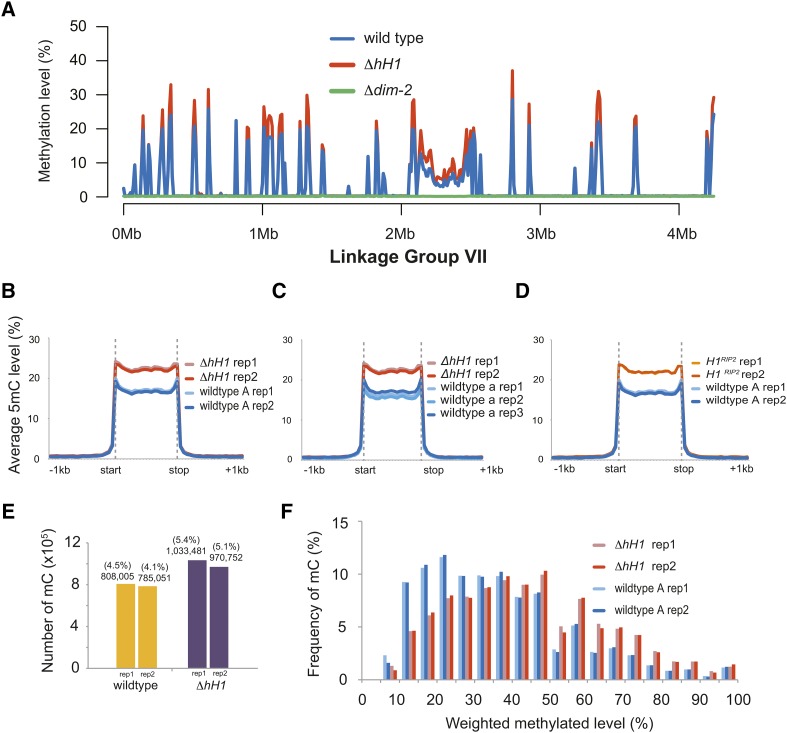
Figure 5.
Increased DNA methylation is observed at most N. crassa heterochromatin domains in H1-deficient strains. (A) The DNA methylation level (weighted DNA methylation level (%); (see Materials and Methods) is shown for 10 kb windows across N. crassa Linkage Group VII for wild-type, the hH1 mutant, and the dim-2 strain, which lacks all DNA methylation. (B–D) The metaplots show the average DNA methylation level across all previously identified wild-type methylated domains: (B) the wild-type mat A strain and the hH1 strain; (C) the wild-type mat a strain and the hH1 strain; and (D) the wildtype mat A strain and the hH1RIP2 strain. Data for at least two independent biological replicates of each strain are shown. (E) More cytosines are methylated in hH1. The plot shows the total number of methylated cytosines (see Materials and Methods) identified in each wild-type and hH1 replicate. (F) The level of methylation at individual cytosines is higher in hH1. The percentage of total shared methylated sites (y-axis) vs. the level of methylation at individual cytosines (x-axis) is shown.

