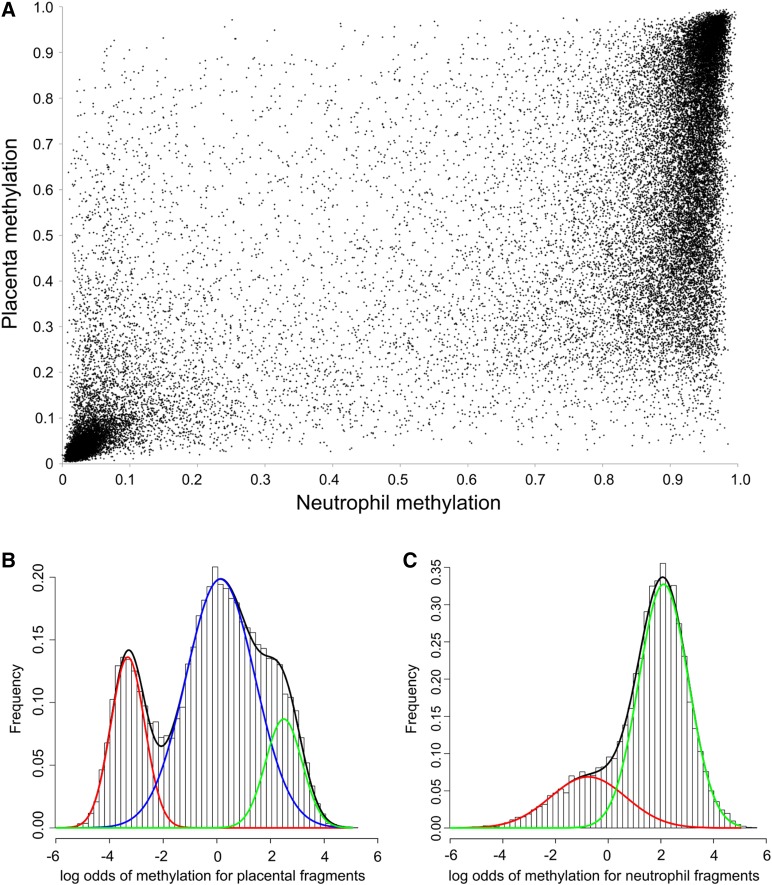
Figure 2.
Methylation distribution in placentas and neutrophils. (A) Mean methylation of comparison fragments for neutrophils (x-axis) and placentas (y-axis). (B) and (C) Logit transformation of methylation values. The black curves show the total density; the red, blue, and green curves show the mathematical decomposition of the distribution of DNA methylation into their Gaussian components.

