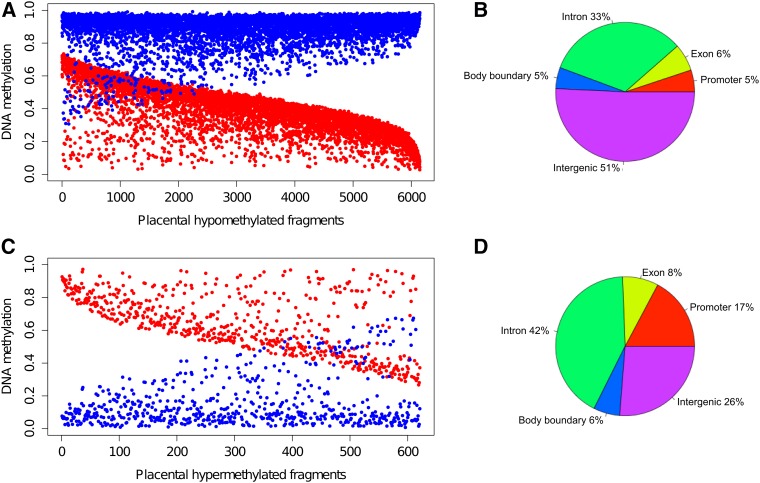
Figure 7.
DNA methylation of differentially methylated fragments (DMFs). (A) placentally hypomethylated DMFs. (B) genomic distribution of the placentally hypomethylated DMFs. (C) placentally hypermethylated DMFs. (D) genomic distribution of the placentally hypermethylated DMFs. Mean methylation of fragments (mean methylation of individuals in one group) in the placenta and neutrophils are shown in red and blue, respectively.

