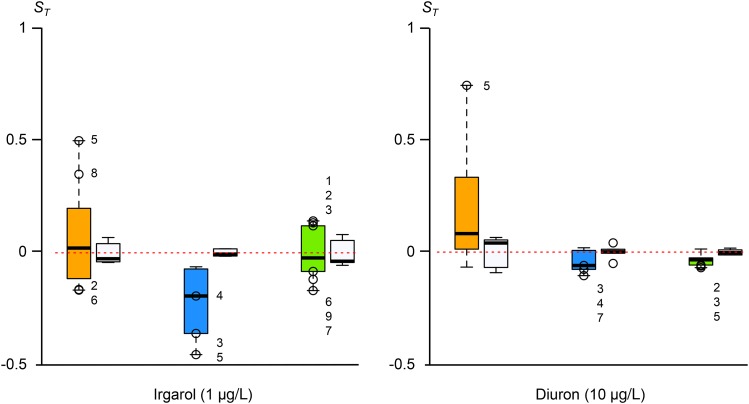
Figure 2.
Selection coefficients, ST, in media containing Irgarol 1051 or Diuron herbicides. Empty circles with a number: MA lines with significant ST differences (Student’s test, p-value < 0.01). Left to right in the two graphs: B. prasinos in orange (eight MA lines), M. pusilla in blue (seven MA lines), and O. mediterraneus in green (nine MA lines). The ST of controls are presented as white plots on the left of the MA lines. MA, mutation accumulation.

