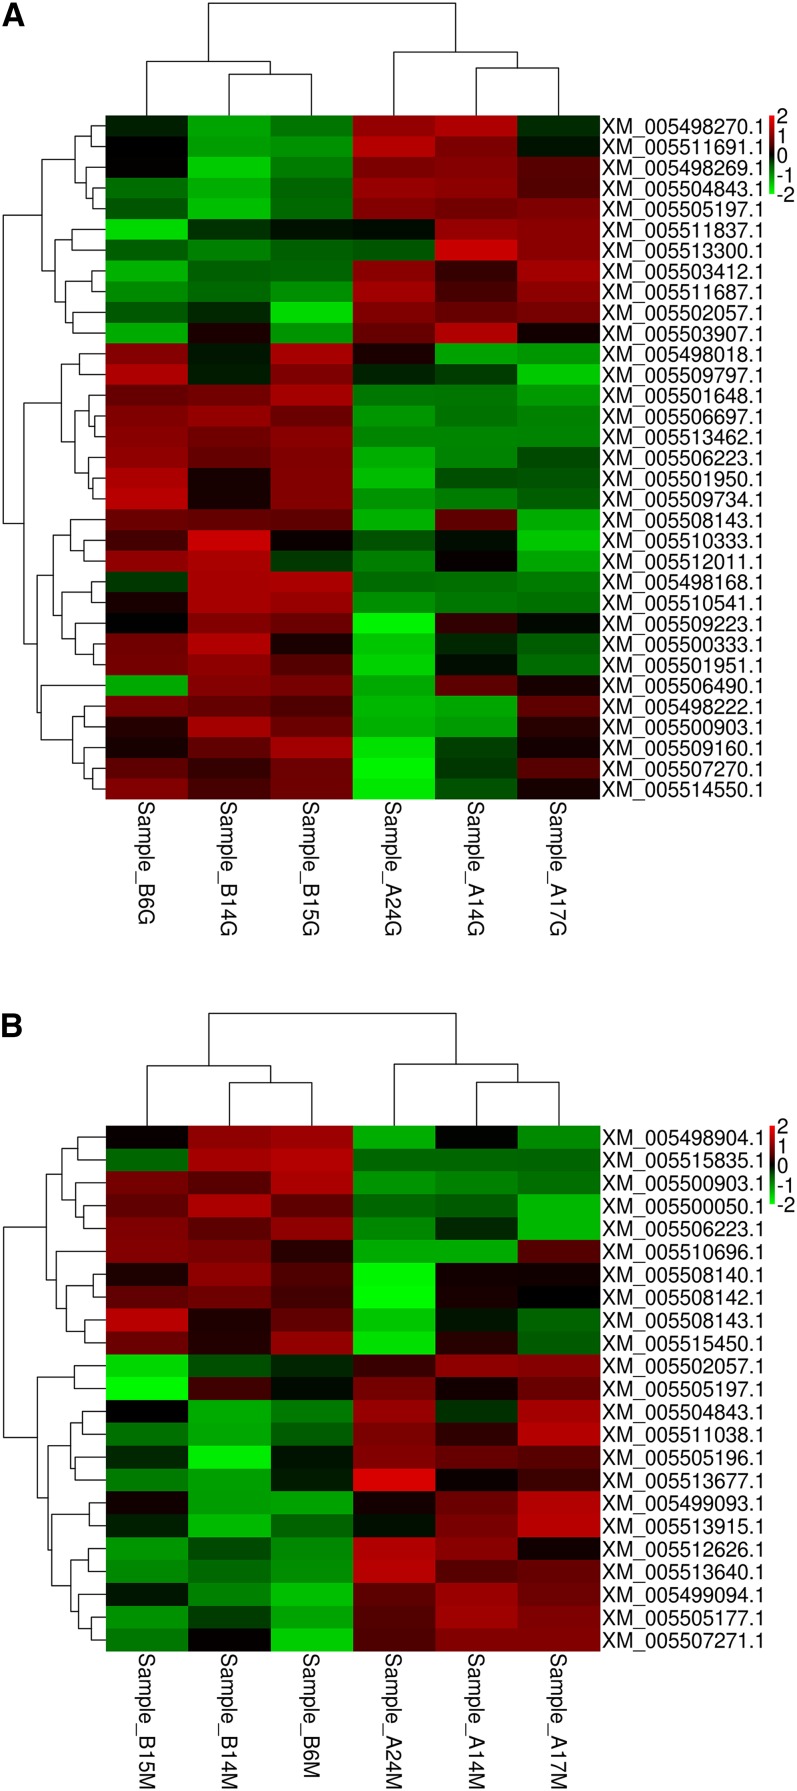
Figure 2.
(A) Heatmap showing expression data for 33 differentially expressed transcripts in the liver tissue. Rows indicate genes with significant expression differences between the two breeds; columns represent individual samples from two pigeon breeds (Sample_A17G, Sample_A14G, Sample_A24G, and Sample_B15G, Sample_B14G, Sample_B6G were from breed A and breed B, respectively). Breed A, White Carneau; breed B, Europigeon. (B) Heatmap showing expression data for 23 differentially expressed transcripts in the muscle tissue. Rows indicate genes with significant expression differences between the two breeds; columns represent individual samples from two pigeon breeds (Sample_A17M, Sample_A14M, Sample_A24M, and Sample_B6M, Sample_B14M, Sample_B15M, were from breed A and breed B, respectively). Breed A, White Carneau; breed B, Europigeon.

