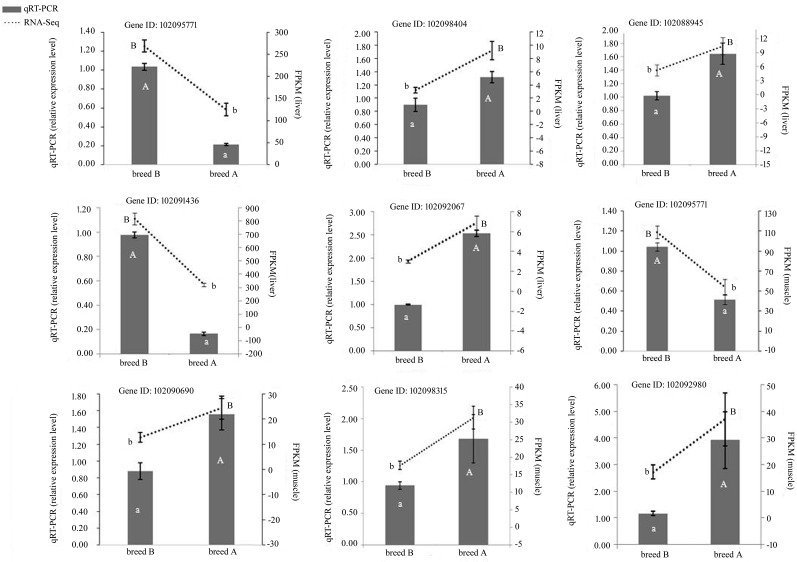
Figure 3.
Expression of eight significant DEGs detected by RNA-Seq and validated by qRT-PCR. Results from RNA-Seq are shown by line graphs on the top and values are shown on the right Y-axis as FPKM. Results from qRT-PCR are shown by bar graphs on the bottom and values are shown on the left Y-axis as relative expression level. Breed A, White Carneau; breed B, Europigeon. “A” and “a” indicate significant difference in the relative expression of genes detected via qRT-PCR at P < 0.05. “B” and “b” indicate significant difference in the expression of mRNA detected from RNA-Seq at P < 0.05. Data are presented as mean ± SE.

