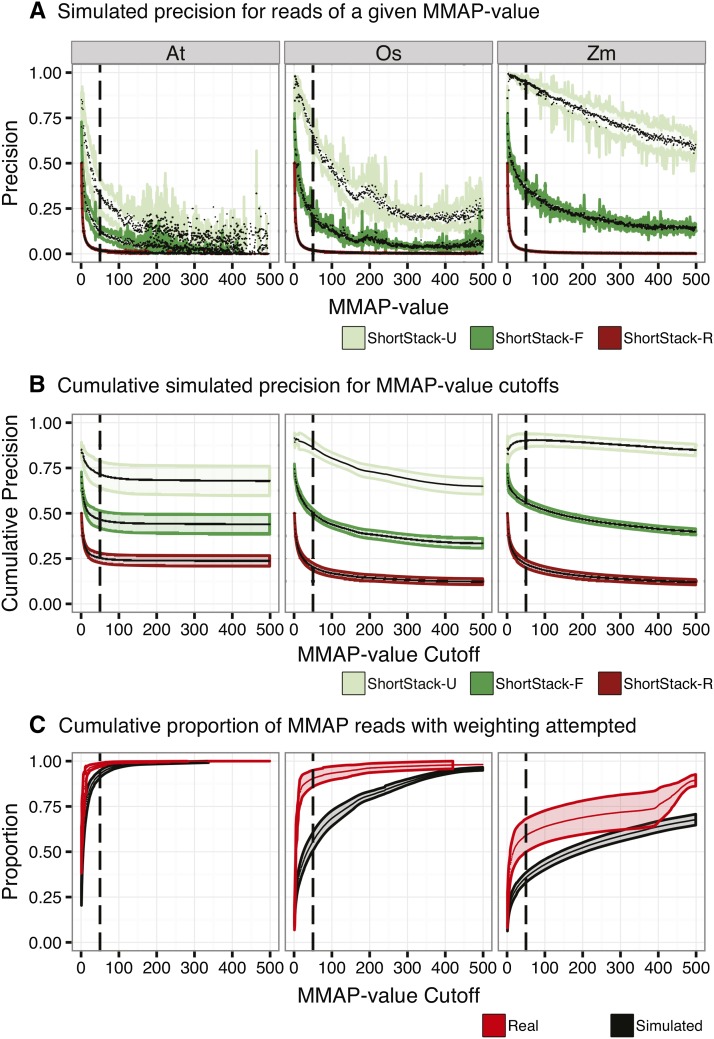
Figure 5.
Influence of MMAP-value on performance. (A) Precision as a function of MMAP-value for simulated sRNA-seq data from the indicated species and alignment method. MMAP-value is the number of possible alignment positions for a read. Colored lines are standard deviations, black dots are mean values. Heavy dashed line at MMAP = 50 indicates the default cutoff value for ShortStack, above which placement of MMAP reads is not attempted. (B) Cumulative precision as a function of MMAP-value for simulated sRNA-seq data from the indicated species and alignment method. Plotting conventions as in (A). (C) Cumulative proportion of real and simulated sRNA-seq data retained by ShortStack alignments under differing MMAP-value cutoffs. Note that simulated libraries have higher proportions of reads with high MMAP values. Plotting conventions as in (A). At, A. thaliana; Os. O. sativa; Zm, Z. mays.

