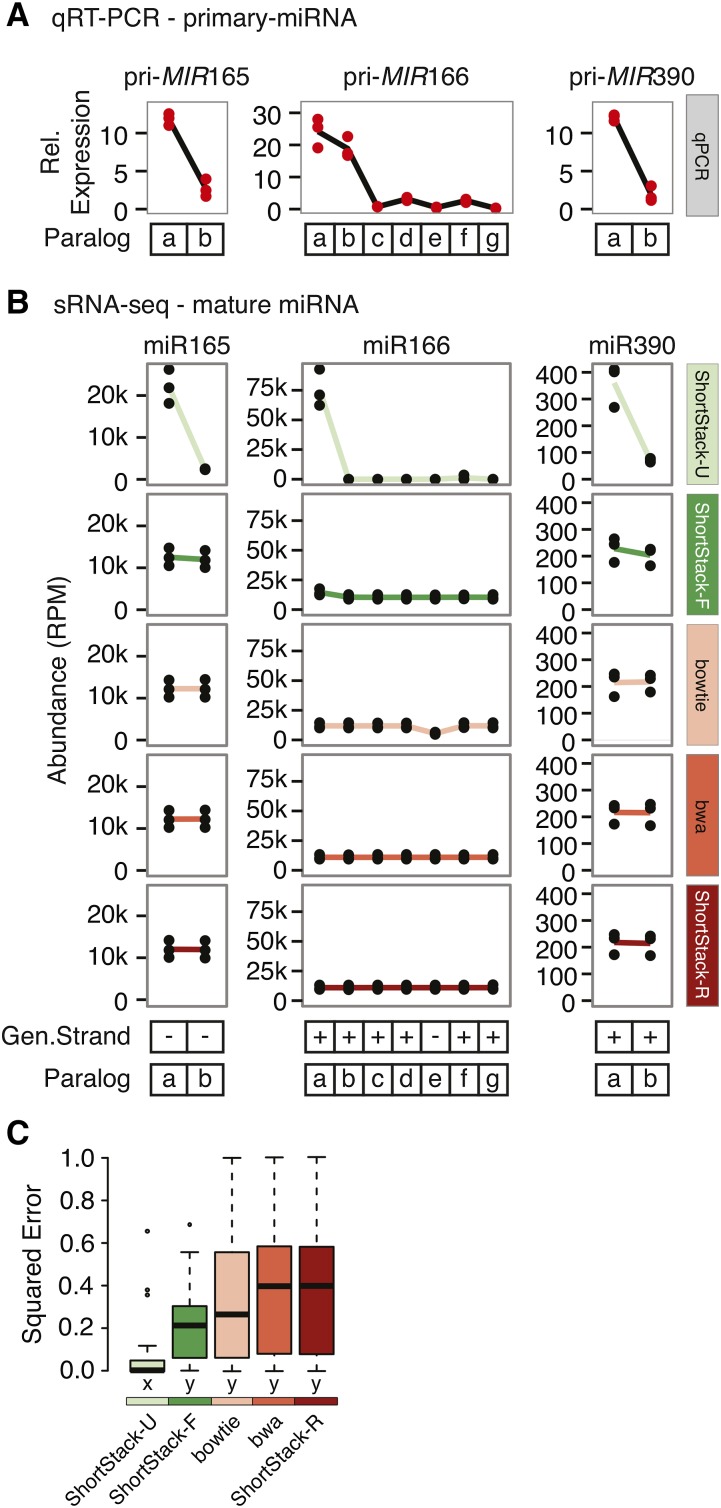
Figure 6.
Experimental assessment of sRNA-seq alignment methods using miRNA paralogs. (A) Relative expression of the indicated primary MIRNA transcripts in A. thaliana Col-0 inflorescences assessed via qRT-PCR. Values are normalized to 1 / 1000 those of ACTIN2. Dots show values from biological replicates (n = 3). (B) Accumulation of the indicated mature miRNAs from each of their possible paralogs as determined by different sRNA-seq alignment methods. Values are from three biological replicate sRNA-seq libraries from A. thaliana Col-0 inflorescences. (C) Squared residual errors from comparisons of scaled qRT-PCR data to scaled sRNA-seq alignment results. Boxplots show medians (horizontal bars), the 1st to 3rd quartile range (boxes), data out to 1.5 times the interquartile range (whiskers), and outliers (dots). Treatments sharing a common letter indicate groups that are not significantly different by nonparametric analysis (Kruskal-Wallis ANOVA with Dunn multiple comparison test, α = 0.05).

