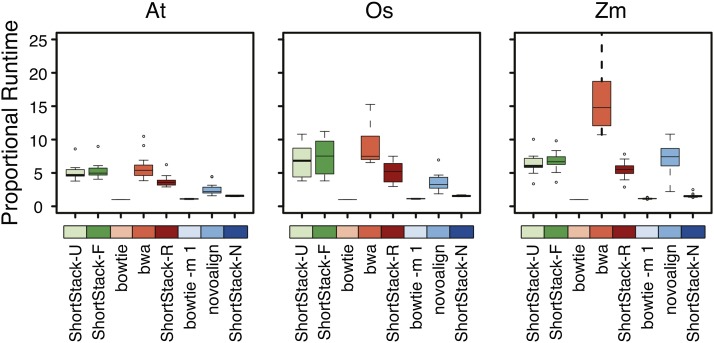
Figure 9.
Comparison of alignment times for real sRNA-seq libraries with the indicated methods. Boxplots show medians (central bars), the 1st to 3rd quartile range (boxes), other data out to 1.5 the interquartile range (whiskers), and outliers (dots); n = 15, 12, and 21 for the At, Os, and Zm data, respectively. At, A. thaliana; Os, O. sativa; Zm, Z. mays.

