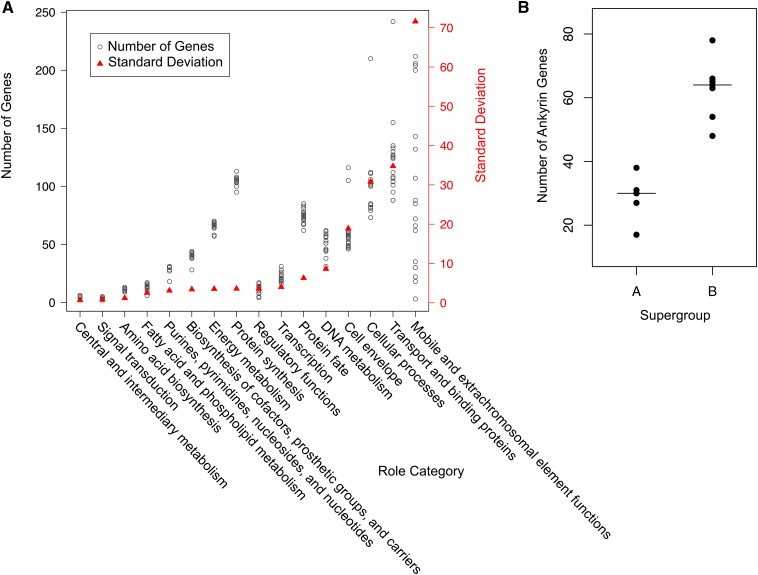
Figure 2.
Gene content of Wolbachia. (A) The numbers of genes in each role category, for each Wolbachia genome are plotted with open circles and correspond to the left axis. Role categories are sorted by standard deviation, represented by the red triangles, and the right axis. (B) Number of ankyrin repeat-containing genes per genome, by supergroup. The B supergroup has a significantly higher number of ankyrin genes than the A supergroup (Mann–Whitney U-test, P = 0.003).

