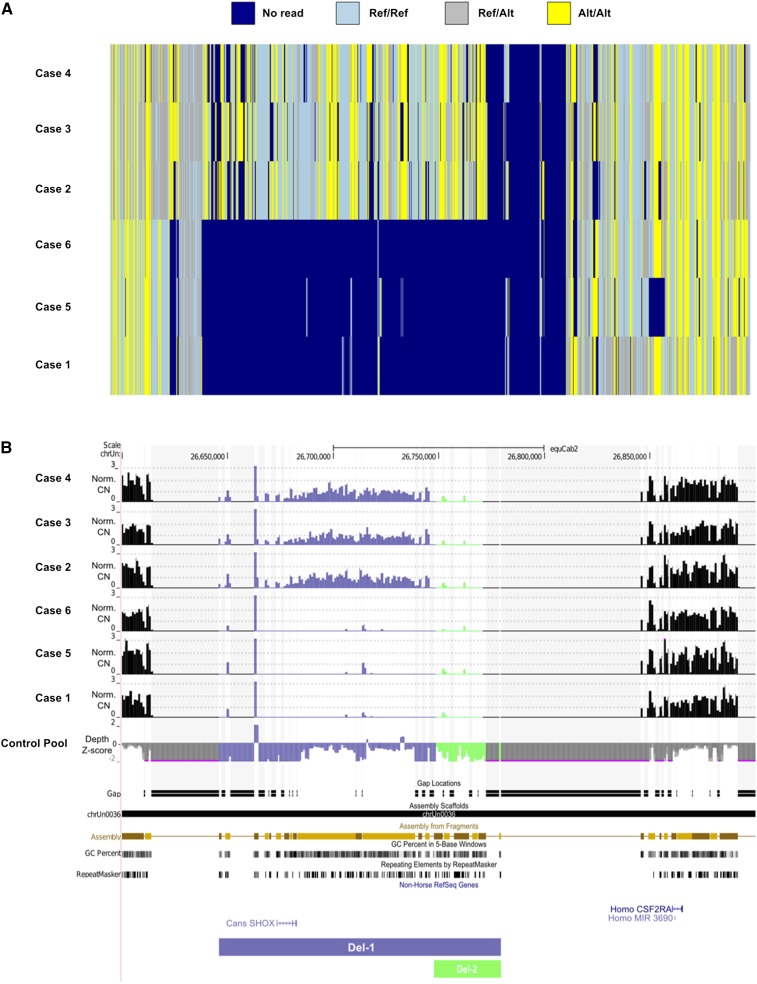
Figure 2.
SNP genotypes and depth pattern on EquCab2.0 unassigned scaffold chrUn0036. (A) SNP genotypes of SA cases. (B) Normalized copy numbers of SA cases in relation to the control pool and Z-score transformation of control pool depth in relation to the average depth over the entire genome. The region shown is chrUn: 26.6−26.9 Mb in UCSC genome browser concatenation of unassigned scaffolds.

