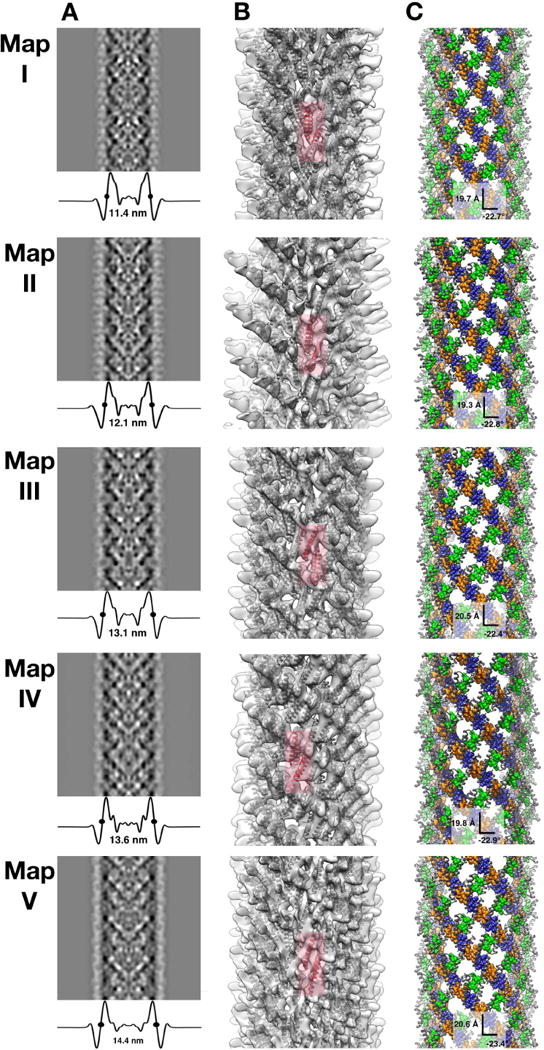
Figure 6. Rev filament polymorphism.

Maps I–V representing different polymorphic states of HIV Rev filaments are presented in each row. All of the maps were low pass-filtered to 12 Å resolution.
(A) Re-projections of each density map (protein is dark) with transverse profiles documenting the differences in filament diameter. In each case. the half-height diameter is marked with two dots.
(B) Isosurface representations, translucent to show docked Rev NTD subunits (gray). A representative A-A dimer is shown in red.
(C) Surface representation of each filament, with A-A, B-B and C-C interfaces colored blue, orange, and green, respectively. The helical step (rise and rotation) is labeled for each reconstruction.
