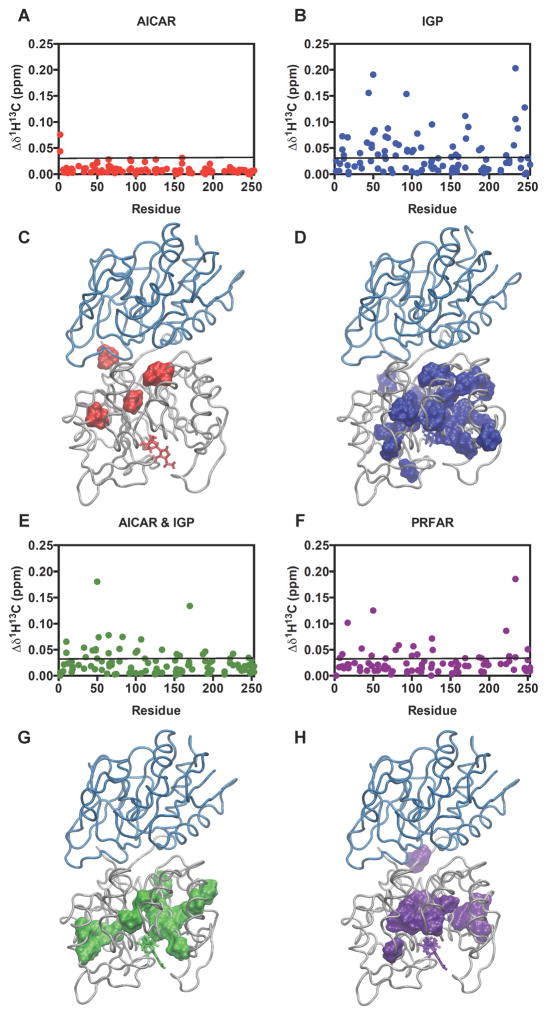
Figure 3.
Ligand-induced chemical shift perturbations. Shown are changes in (A) AICAR, (B) IGP, (E) AICAR & IGP, and (F) PRFAR effector-bound ternary complexes relative to apo IGPS. Black lines represent 1.5σ from the 10% trimmed mean of the four combined data sets. Significant changes (above the black line) are mapped onto the HisF structure (C,D,G,H) (PDB 1GPW).(Douangamath et al., 2002) See also Figures S3–S5.

