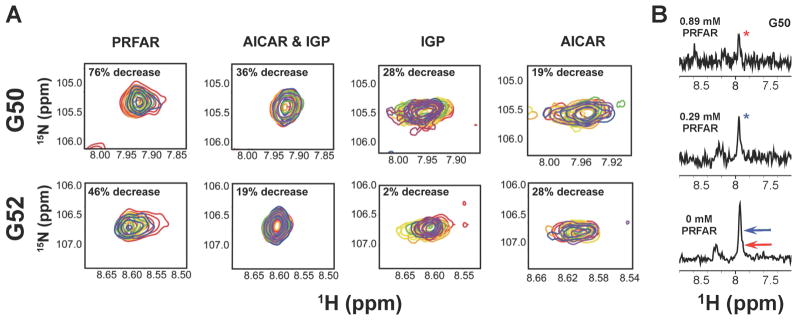
Figure 4.
Ligand-induced exchange broadening of hG50 and hG52 located in the HisH PGVG loop. (A) The ligand titration ranges from red (apo) to purple (effector-saturated) and percent decrease in peak intensity is shown in the inset. (B) One dimensional slices of the hG50 resonance showing the decrease in peak intensity from PRFAR binding. Relative peaks heights of the ligand-bound resonances are shown with arrows in the bottom panel.

