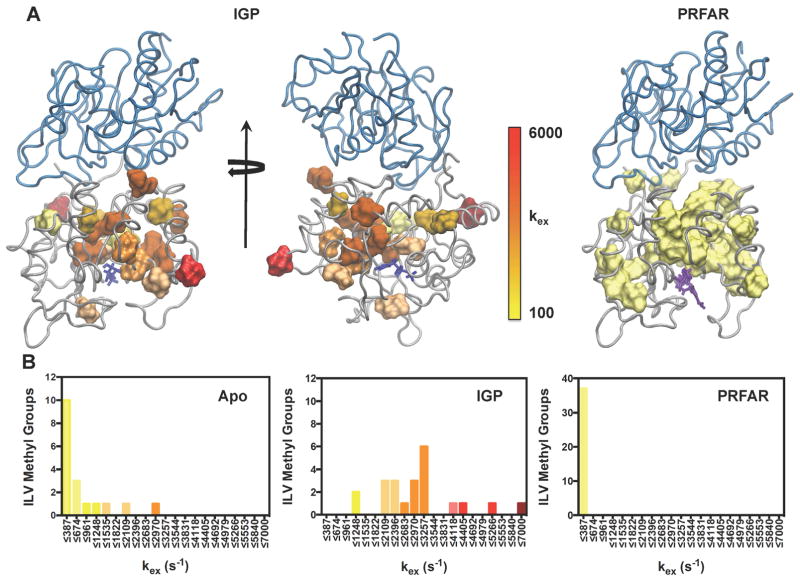
Figure 7.
Structural clustering of kex from NMR relaxation dispersion. (A) The magnitudes of kex are mapped onto the structure of the IGP (left, middle) and PRFAR (right) ternary complexes for all residues undergoing ms exchange. Other IGPS complexes are in SI Fig 7. (B) Distribution of kex values for the apo enzyme (left), IGP ternary complex (middle), and PRFAR ternary complex (right). Colors in each histogram correlate with the legend in (A). Optimal bin sizing for these data were determined using the protocol outlined in (Scott, 1979). IGP, PRFAR, and acivicin are represented with blue, purple, and orange sticks, respectively. See also Tables S2–S7 and Figure S6.

