
Figure 5. Effects of arsenic species on mitochondrial content and morphology.
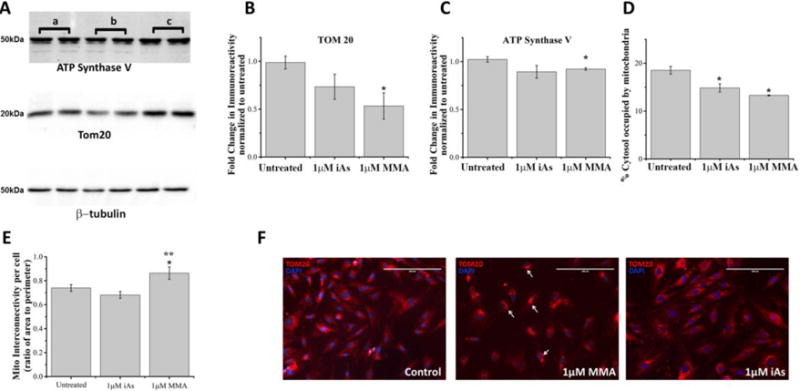
A. Representative Western blot analyses of the total cellular levels of mitochondrial markers (TOM20 and ATP synthase V) and of β-tubulin in cell lysates from untreated cells (lanes indicated by a), and cells exposed for 5 hours to 1μM MMA(III) (lanes indicated by b) or exposed to 1μM iAs(III) (lanes indicated by c).
B. Densitometric analyses of the immunoreactivity of the outer membrane localized protein TOM20 as assessed by Western blot of cell lysates from cells treated with indicated concentrations of MMA(III) and iAs(III) and normalized to untreated cells. (*:p<0.05 vs. untreated, Means, ±SE, n=5 lanes/condition). One-way ANOVA, Tukey’s HSD. Data was compiled from three independent Western blot experiments.
C. Densitometric analyses of the immunoreactivity of the inner membrane localized protein ATP Synthase V as assessed by Western blot of cell lysates derived from cells treated with indicated concentrations of MMA(III) and iAs(III) and normalized to untreated cells. (*:p<0.05 vs. untreated, Means, ±SE, n=5 lanes/condition). One-way ANOVA, Tukey’s HSD. Data was compiled from three independent Western blot experiments.
D. Image-based quantification of mitochondrial content in paraformaldehyde-fixed cells immunolabeled for TOM20 as assessed by measuring the percentage of the cytosolic area occupied by fluorescently-labeled mitochondria-specific pixels and normalized to untreated cells. (*:p<0.05 vs. untreated cells, Means, ±SE, n=44–57 cells/condition). One-way ANOVA, Fishers LSD Tukey’s HSD. Data was compiled from three independent experiments.
E. Mitochondrial interconnectivity, defined as the ratio of the average area to the perimeter of mitochondria per cell (Dagda et al. 2009), was measured in untreated cells and in cells treated with the indicated concentrations of iAs(III) and MMA(III). Cells treated with MMA(III) had significantly increased interconnectivity compared to untreated cells or cells treated with iAs(III) (*:p<0.05 vs. untreated, **:p<.05 vs. 1μM iAs(III), Means, ±SE, n=44–57 cells/condition). One-way ANOVA, Fishers LSD Tukey’s HSD. Data was compiled from three independent experiments.
F. Representative epifluorescence micrographs of paraformaldehyde-fixed cells immunolabeled for TOM20 (red) and counterstained with DAPI to visualize mitochondria and nuclei respectively. Epifluorescence micrographs were acquired at a magnification of 20×. While untreated VSMCs showed a normal mitochondrial morphology (tubular to interconnected), cells treated with MMA(III), but not iAs(III), showed the presence of aberrant mitochondrial clusters (indicated by white arrows). Data is representative of one of three experiments with similar results.