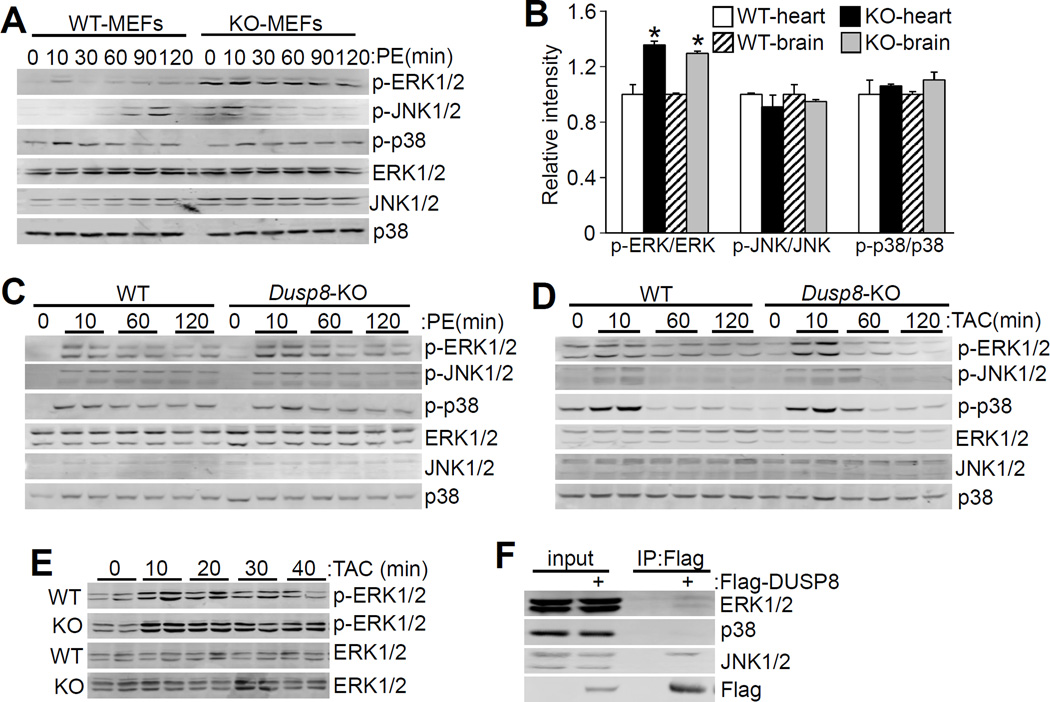
Figure 3. Loss of Dusp8 leads to increased ERK1/2 phosphorylation.
A, Western blot assessment of MAPK phosphorylation and total MAPK levels in Dusp8 WT and KO MEFs in culture with or without PE stimulation at 10 μmol/L for the indicated times (0 time point is no PE stimulation). Of note, there is an open lane between the 6 WT and KO protein samples on the Western blot, given the variable bleed over from the adjacent lanes. B, Quantitative analysis of phosphorylated MAPKs relative to total MAPKs in 2 month-old Dusp8 WT and KO hearts and brains shown in Online Figure IIIB. N=4 for each group. *p<0.05 vs WT. C, D and E, Western blot analysis of cardiac MAPK phosphorylation and total MAPK levels in Dusp8 WT or KO mice after (C) PE or (D and E) TAC stimulation as indicated in the panel, for the indicated period of time in minutes. N=4 or greater for each. F, Western blot analysis of interaction between endogenous MAPKs (ERK1/2, p38, and JNK1/2) and exogenously expressed Flag-DUSP8 in HEK293 cells. This experiment was repeated three times with similar results.

