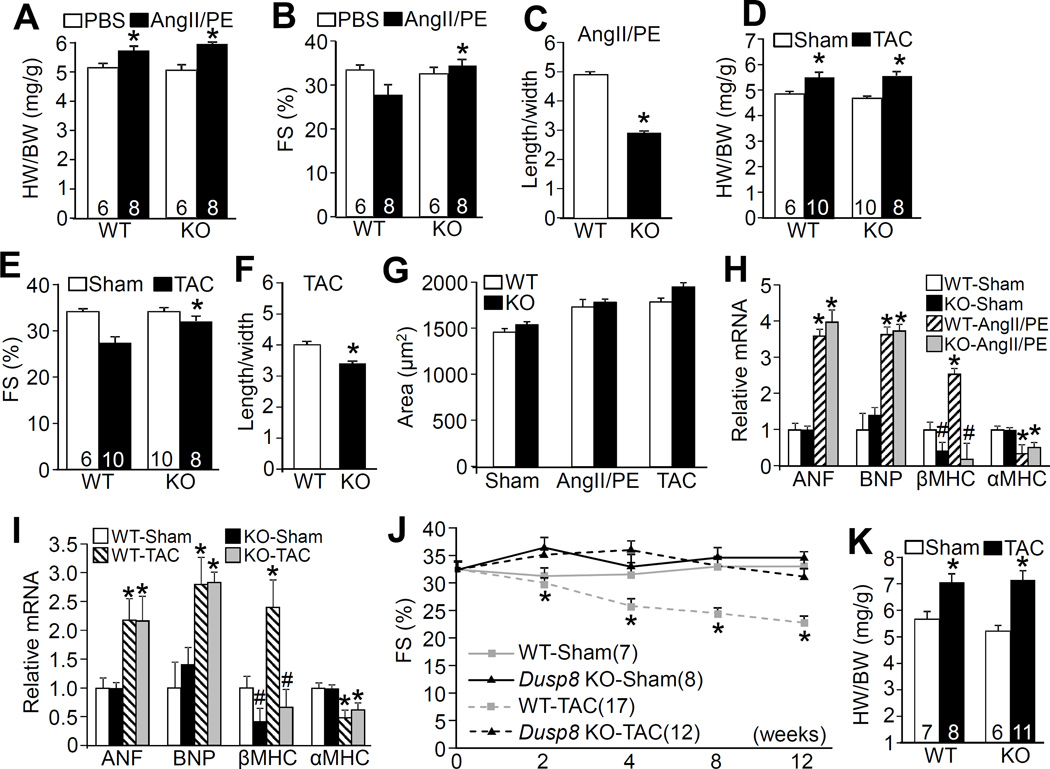
Figure 4. Analysis of cardiac hypertrophy and remodeling in Dusp8 KO mice after stress stimulation.
A, HW/BW ratio in Dusp8 WT and KO mice 2 weeks after AngII/PE infusion or PBS control. Number of mice used is shown within the bars. *p<0.05 vs PBS. B, Echocardiographic assessment of FS in Dusp8 WT and KO mice after 2 weeks of AngII/PE infusion. *p<0.05 vs WT AngII/PE. Number of mice analyzed is shown in the bars. C, Analysis of length/width ratio of adult cardiac myocytes isolated from Dusp8 WT and KO mice after AngII/PE infusion. Approximately 250 myocytes were analyzed for each group. *p<0.05 vs WT. D, HW/BW ratio in Dusp8 WT and KO mice 2 weeks after TAC or a sham procedure. Number of mice analyzed is shown in the bars. *p<0.05 vs Sham. E, Echocardiographic analysis of FS in Dusp8 WT or KO mice after 2 weeks of TAC or a sham procedure. *p<0.05 vs WT TAC. Number of mice analyzed is shown in the bars. F, Analysis of length/width ratio of adult cardiac myocytes isolated from Dusp8 WT and KO mice after 2 weeks of TAC. Approximately 250 myocytes were analyzed for each group.*p<0.05 vs WT. G, Analysis of adult cardiac myocyte area from dissociated hearts from Dusp8 WT and KO mice after AngII/PE, TAC or a sham procedure. Approximately 250 myocytes were analyzed for each group. H and I, Real-time PCR analysis of mRNA levels of ANF, BNP, βMHC, and αMHC from hearts of Dusp8 WT and KO mice after AngII/PE (H) or TAC (I) stimulation for 2 weeks compared to sham operated groups. At least 4 mice (hearts) were analyzed in each group. *p<0.05 vs WT or KO sham; #p<0.05 vs WT sham. J, Echocardiographic analysis of FS in Dusp8 WT and KO mice following TAC or a sham procedure for the indicated time in weeks. *p<0.05 vs KO TAC. Number of mice analyzed is shown. K, HW/BW ratio in Dusp8 WT and KO mice 12 weeks after a TAC or a sham procedure. Number of mice analyzed is shown in the bars. *p<0.05 vs Sham.

