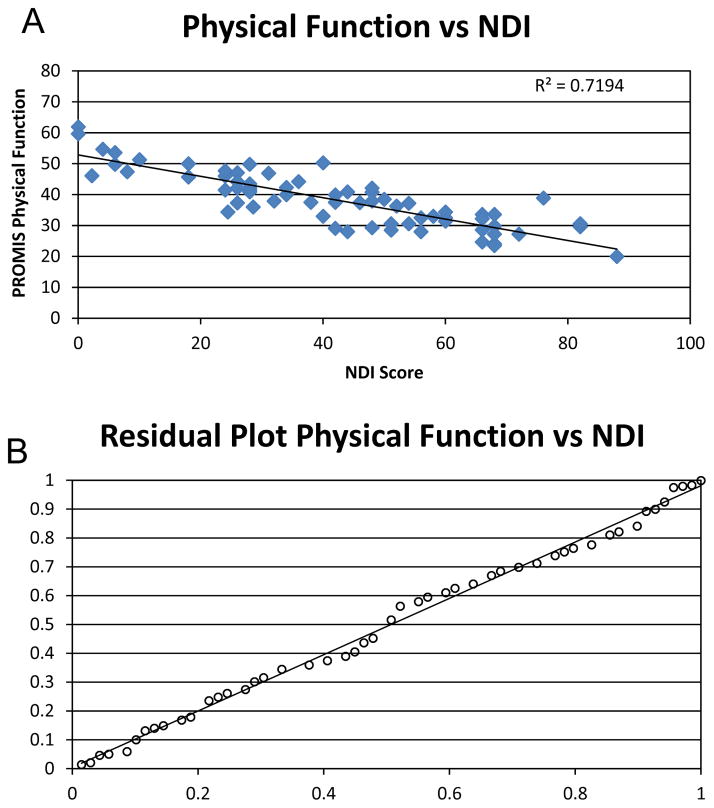
Figure 2. Linear regression analysis.
Linear regression plots are shown illustrating the correlation of NDI with PROMIS physical function CAT for all patient visits (A). A significant correlation between NDI and PROMIS was found with a combined correlation value of 0.8482 (p<0.001). Residual plot demonstrate the appropriate use of a linear fit for the regression analysis, with a random and equal distribution about the predicted line (B).

