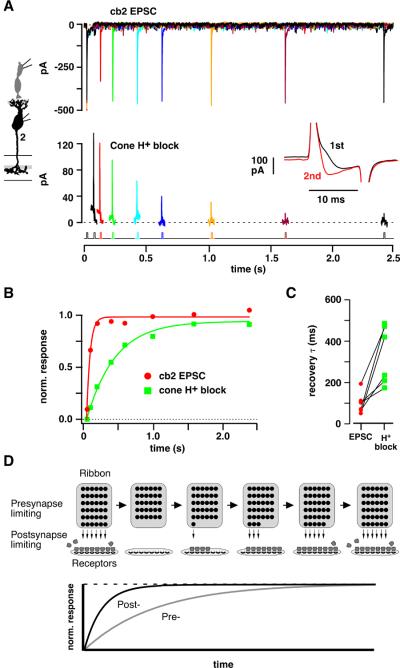
Figure 3. Simultaneous measurement of H+ block and cb2 EPSC recovery.
A. (Upper panel) Paired pulse response in a cb2 cell during 15 ms cone steps from −70 to −30 mV. (Lower panel) H+ block measured as the difference between the current during the first and second steps. With increasing interpulse interval, the H+ block during the second pulse more closely approximates that of the first and the difference current becomes smaller. Inset: Pair of cone step currents separated by a 50 ms interval. The difference current equals the 1st trace minus the 2nd. B. Plot of normalized recovery versus interpulse interval. C. Pre- and postsynaptic recovery τ's. Lines connect simultaneous measurements (n = 6 pairs). D. Mechanism of fast postsynaptic recovery. After an initial brief depolarization that releases the vesicles docked in the first ribbon row, new vesicles dock and become competent to fuse over time (rightward progression indicated by arrows illustrating the case where the presynaptic recovery is limiting). A second pulse releases the contents (convex shapes) of newly competent vesicles. Postsynaptic recovery can be limiting under conditions where transmitter concentrations are high and receptors saturate before the presynapse fully recovers.

