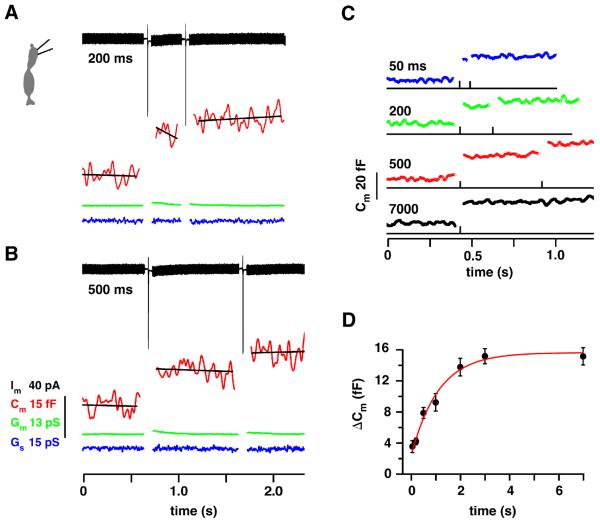
Figure 4. Cone membrane capacitance change (ΔCm) as a function of interpulse interval.
A. ΔCm was measured before and after 1 ms steps separated by 200 ms. A thick membrane current trace (Im, black) is produced by the response to the sinusoidal voltage command. The sharp inward deviations result from Ca2+ current activation during the 1 ms steps. The Lockin parameters were: membrane conductance (Gm, green trace), Cm (red trace), and series conductance (Gs, blue trace). The capacitance traces were fitted with a straight line to determine the average value. B. Same as `A' but with a 500 ms interval. Steps were from −70 to −10 mV. Scale bars apply to A and B. C. Average ΔCm responses for the interpulse intervals at left (n = 6 cones). D. Plot of ΔCm during the second pulse versus interpulse interval. Data was not normalized since the responses to the first jump were similar. The recovery τ was 1.11 s (red curve). Including zero in the fit produced a τ = 0.70 s (not shown).

