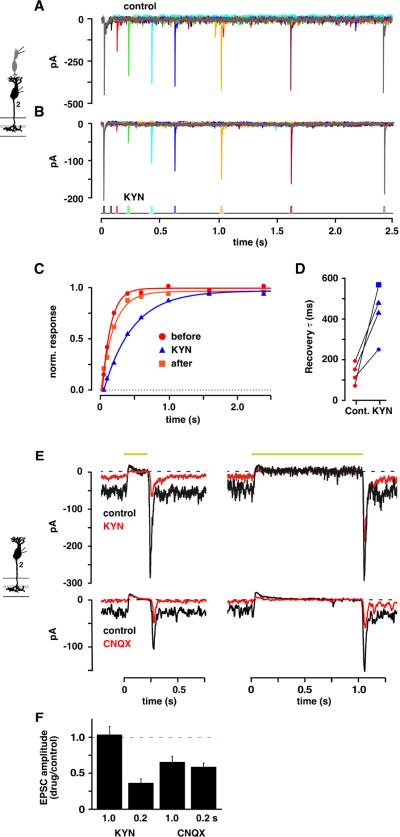
Figure 6. Weak antagonists relieve receptor saturation at the cone to cb2 cell synapse.
A cone was depolarized from −70 to −30 mV for 15 ms in whole cell voltage clamp. Paired pulse recovery of the EPSC response was measured in A. control and then in B. a 2 mM KYN-containing solution. C. Normalized recovery versus interpulse interval in control (red circles) and 2 mM KYN (blue triangles). D. Recovery τ's in control and KYN with results from the same pair connected (KYN: blue square = 4 mM; blue circle = 1 mM). The τ in control is an average of before and after treatment. Decreased amplitude (%) in KYN from top to bottom equaled 65.7, 61.3, 58.5, 29.4. E. Light responses in control and 1 mM KYN (upper) or 0.4 μM CNQX (lower) containing-solution during steps of either 0.2 or 1.0 s (light intensity = 3.0 × 10⁶ photons-μm−2-s−1; rows show responses from the same cell; traces are averages). F. Histogram of EPSC amplitude in drug (KYN, n = 6; CNQX, n = 9) divided by control solution for the two light step durations.

