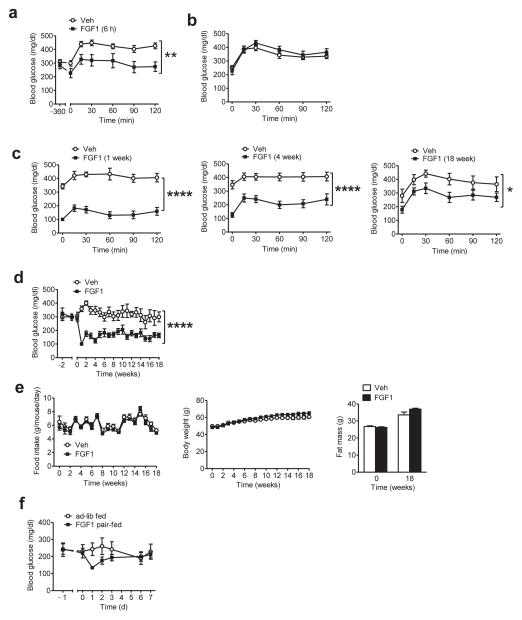
FIGURE 1.
Diabetes remission induced by a single i.c.v. FGF1 injection in ob/ob mice. (a,b) Blood glucose levels during an intraperitoneal glucose tolerance test (ipGTT) performed in fasted ob/ob (B6) mice 6 h after (a) a single i.c.v. injection of either vehicle (Veh; open symbols; n = 8) or 3 μg of mFGF1 (black symbols: n = 9), or (b) a single s.c. injection of either Veh or the same dose of mFGF1 (Veh, n = 7; FGF1, n = 6). (c) Blood glucose values from an ipGTT performed in fasted ob/ob (B6) mice either 7 d (left), 4 weeks (middle), or 18 weeks (right) following a single i.c.v. injection of mFGF1 (3 μg). (d) Time course of blood glucose levels from the same cohort of ad-libitum (ad-lib)-fed ob/ob mice both prior to and after a single i.c.v. injection of mFGF1 (3 μg). (e) Food intake (left), body weight (middle), and fat mass (right) of ob/ob (B6) mice following i.c.v. injection of either mFGF1 or Veh. (f) Daily blood glucose levels from i.c.v. Veh-injected ob/ob mice that were fed either ad-lib (n = 10) or pair-fed to a separate cohort of mice that had received i.c.v. mFGF1 (3 μg; n = 10). Data are the mean ± s.e.m. *P < 0.05, **P < 0.01, ****P < 0.0001 for group (Veh vs. FGF1) by repeated measures designs by linear mixed model analyses.

