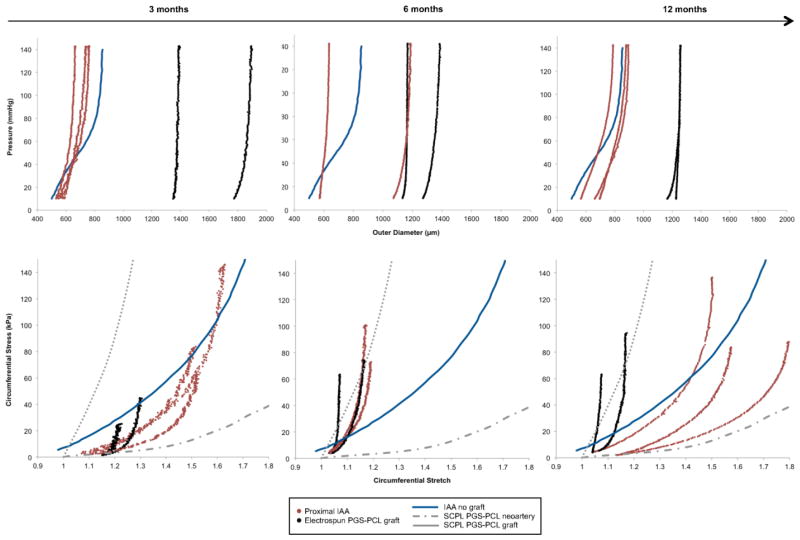
Figure 6.
(A) Pressure-diameter responses of individual PGS-PCL grafts (shown in black) and adjacent proximal infrarenal abdominal aortas (IAA) (shown in red) at 3, 6, and 12 months following graft implantation. Data are plotted as the last cycle of unloading at the individual in vivo axial stretch following preconditioning. Note the significant mismatch between the outer diameter of the TEVG and the native proximal IAA despite nearly matching the luminal diameters. When compared to findings at 3 months, there is a significant dilation and structural stiffening of the proximal IAA at 6 months that appears to resolve partially by 12 months. In contrast, apart from a decrease in graft thickness (likely secondary to polymer degradation), there is little change in the mean structural properties of the TEVGs throughout the 12-month period of implantation. Also shown for purposes of comparison is the pressure-diameter response for a native proximal IAA in the absence of graft implantation5 (blue). (B) Circumferential Cauchy stress-stretch data (for individual grafts, shown in black, and adjacent proximal IAAs, shown in red) explanted at 3, 6, and 12 months. Data are plotted as the last cycle of unloading at the individual in vivo axial stretch following preconditioning. As can be seen, the grafts have significantly higher material stiffness when compared with the proximal IAA, and this does not appear to evolve throughout the 12 months of implantation. In contrast, the proximal IAA undergoes significant circumferential stiffening from 3 to 6 months, after which it appears to overcompensate by becoming circumferentially more compliant than the native IAA at 12 months. Shown for purposes of comparison are the circumferential Cauchy stress-stretch curve for native IAAs in the absence of a graft5 (blue) and stress-strain curves adapted from Wu et al.29 for the SCPL PGS-PCL composite grafts both prior to implantation (dotted grey) and after development into neoarteries explanted at 3 months (dashed grey).

