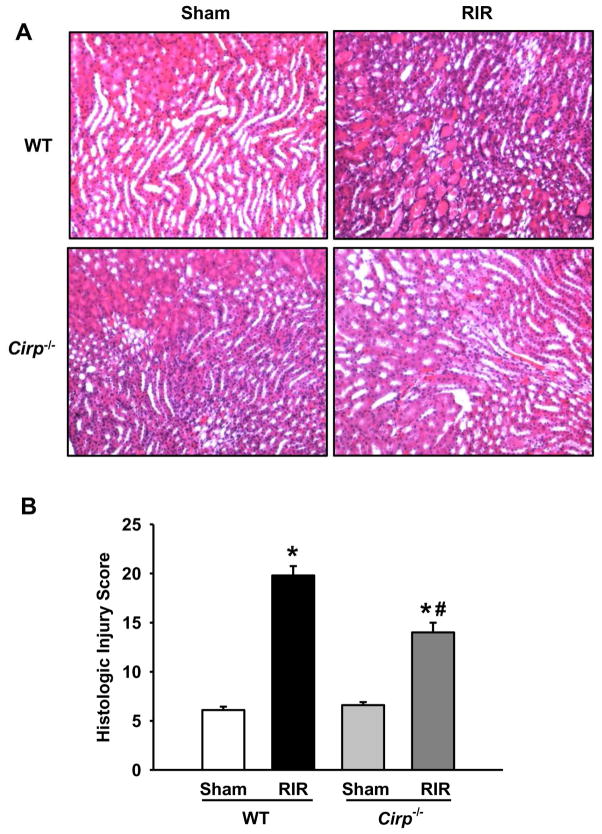
Figure 3. Histological changes in WT and Cirp−/− kidneys after RIR.
Renal tissue from sham WT and Cirp−/− mice and WT and Cirp−/− mice after RIR were harvested and subjected to histological analysis with hematoxylin-eosin staining. (A) Representative images were chosen from each group out of 10 randomly selected fields. Magnification 200×. (B) Histologic injury score measuring severity of tubular cell injury, tubular cell detachment, loss of brush border, tubular simplification, and cast formation on scale of 1–5 per category, as described in Materials and Methods. n=5–9 mice/group. Data are expressed as mean ± SEM and compared by one-way ANOVA by SNK method. *p<0.05 vs WT sham; # p<0.05 vs WT vehicle.

