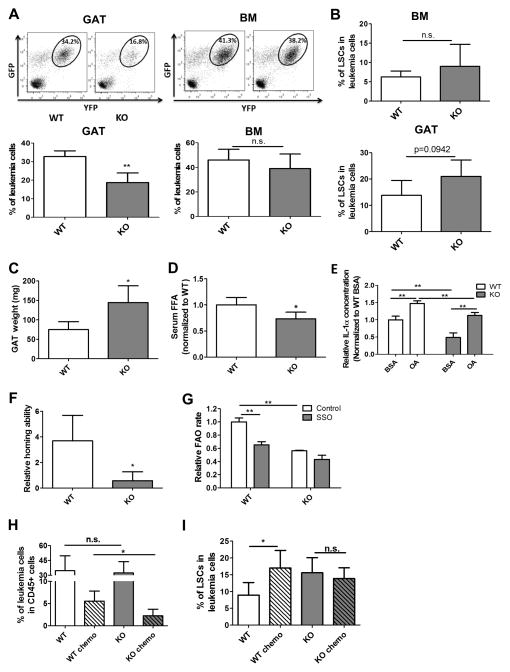
Figure 6. Loss of CD36 decreases leukemic burden in gonadal adipose tissue and sensitizes LSCs to chemotherapy.
(A) Leukemia burden in the GAT and BM of wild type (WT) vs CD36 knock-out (KO) leukemia mice. Error bars show means ± S. D. n=5, ** P<0.005. (B) Percentage of LSCs in BM and GAT resident leukemia cells from WT and CD36 KO leukemia mice. Error bars show means ± S. D. n=5. (C) GAT weight in WT and KO leukemia mice. Error bars show means ± S. D. n=5, * P<0.05. (D) Serum FFA level in WT and KO leukemia mice. Error bars show means ± S. D. n=5, * P<0.05. (E) Secretion of IL-1α in WT and CD36KO leukemia cells. Leukemia cells (1 million/ml) were treated with BSA or OA (100μM) for 24h, and ELISA was performed to determine the concentration of IL-1α in media. Error bars show means ± S. D. from triplicates. ** P<0.005. (F) Homing ability of WT and CD36 KO LSCs to GAT. Homing ability of LSCs was determined by the ratio of the percentage of LSCs in the leukemia cells localized to GAT to the percentage of LSCs in leukemia cells before injection. Error bars show means ± S. D. n=4, * P<0.05. (G) FAO rate in WT and CD36KO LSCs. FAO rate was measured with or without the CD36 inhibitor SSO (50 μM). Error bars show means ± S. D. from triplicates. ** P<0.005. (H and I) Percentage of residual leukemia cells (H) as well as LSCs (I) was determined in WT and CD36 KO leukemia mice after chemotherapy. Error bars show means ± S. D. n=5, * P<0.05.

