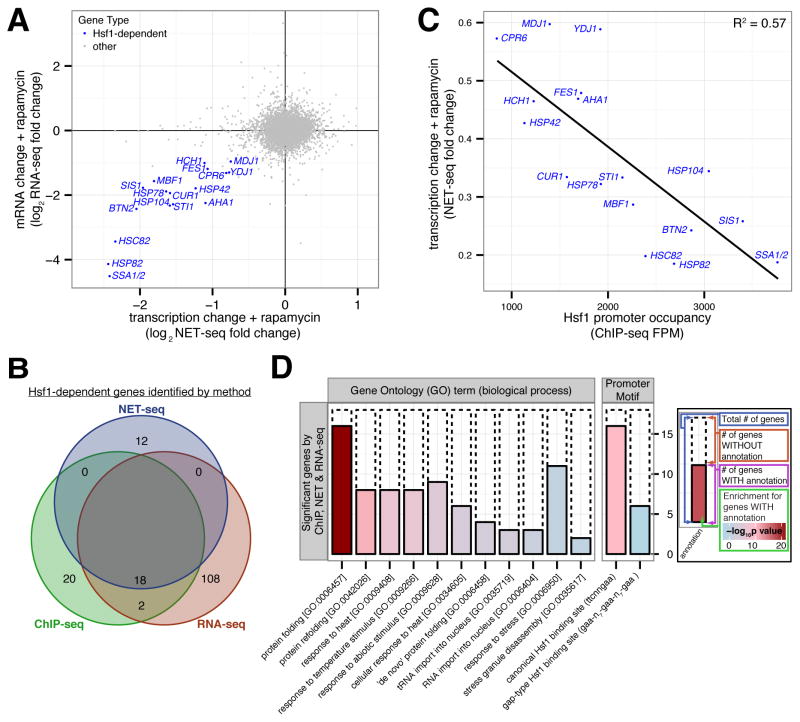
Figure 2. Hsf1 drives basal expression of a diverse set of protein folding factors.
(A) Hsf1-AA cells were grown logarithmically at 30°C and harvested for analysis by NET-seq or RNA-seq immediately prior to and after 15′, 30′ and 60′ of rapamycin treatment. Shown is a gene scatter plot of transcription versus mRNA changes induced by treatment with rapamycin for 15′ and 60′, respectively. (B) Venn diagram comparing Hsf1 target genes defined by ChIP-, NET- and RNA-seq, with the names of the 18 Hsf1-dependent genes (HDGs) detected by all 3 techniques indicated. (C) Gene scatter plot of change in HDG transcription resulting from 15′ of rapamycin treatment versus Hsf1 occupancy at HDG promoters. (D) Bioinformatic analysis of the 18 HDGs defined by ChIP-, NET- and RNA-seq. Solid bars show the number of HDGs with the given annotation (GO term or promoter motif) and dashed bars show the remaining number of HDGs. The fill color indicates the significance level for the enrichment of the annotated HDGs versus other genes. See Supplementary Figure 2J for a similar bioinformatic analysis of Hsf1 targets defined by each individual genome-wide approach or by combining any two approaches. See also Figure S2 and Tables S1–3.

