Fig. 1.
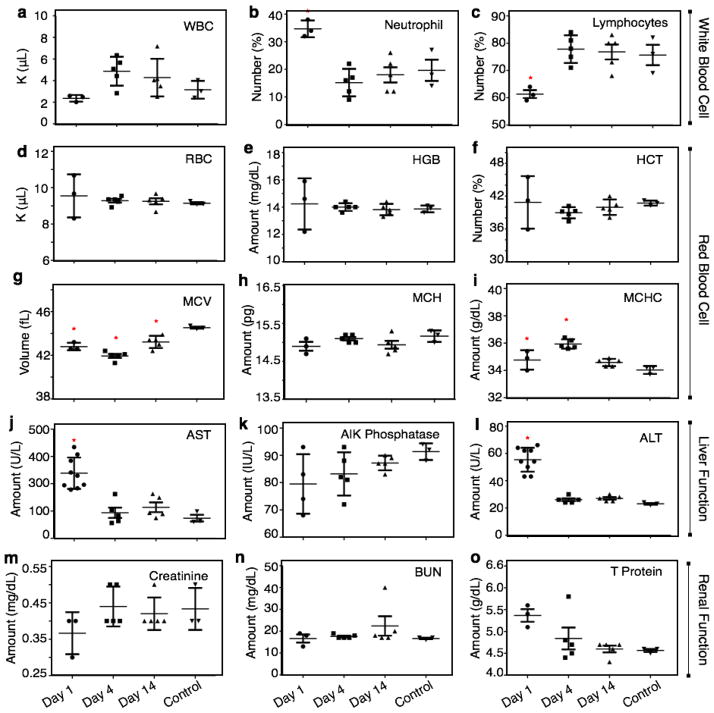
(a–c) White blood counts of balb/c mice following injection of SPN-P8. Mean with SEM of white blood cell (WBC) numbers (a), percentage of neutrophils among white blood cells (b), percentage of lymphocytes among white blood cells (c). (d–i) Red blood counts of balb/c mice following injection of SPN-P8. Mean with SEM of red blood cell (RBC) numbers (d), hemoglobin (HGB) content (e), hematocritmean (HCT) content (f), mean corpuscular volume (MCV) (g), corpuscular hemoglobin (MCH) (h) or mean corpuscular hemoglobin concentration (MCHC) (i). (j–l) Liver function test results of balb/c mice following injection of SPN-P8. Mean with SEM of aspartate aminotransferase (AST) numbers (j), alkaline phosphatase (k) or alanine aminotransferase (ALT) (l). (m–o) Renal function test results of balb/c mice following injection of SPN-P8. Mean with SEM of creatine (m), blood urea nitrogen (BUN) numbers (n) or total protein (T protein) (o). Each group had 3–5 balb/c mice per group. Each group had 3–5 balb/c mice per group. Data are plotted over a period of 14 days following injection of SPN-P8 or saline (control). Data for AST and ALT were repeated in a cohort of 5 animals to confirm findings. Statistically significant differences (p<0/05) are indicated with an asterisk.

