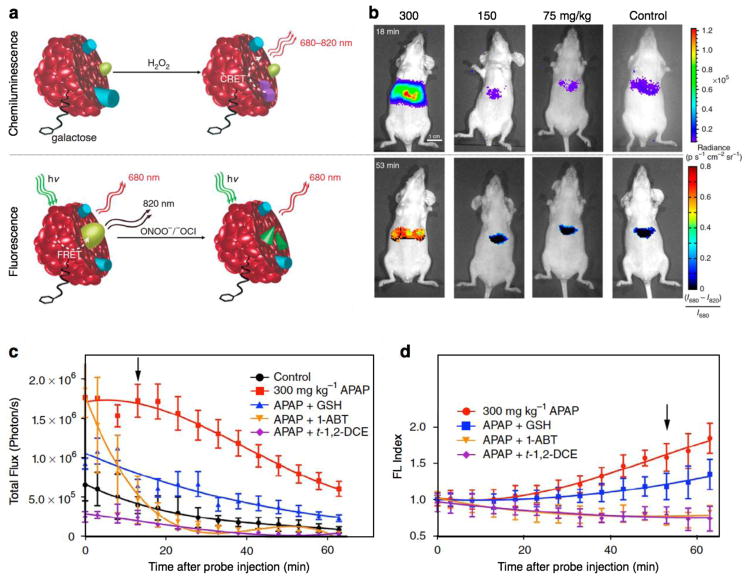
Fig. 6.
(a) Illustration of the mechanism of simultaneous and differential detection of ONOO− or −OCl and H2O2 by CRET/FRET-SPN. After drug challenge to the liver, the SPN report via the chemiluminescent and fluorescent channels the generation of radical metabolites at safe (left) and toxic (right) drug doses. (b) Real-time in vivo imaging of hepatotoxicity after acetaminophen administration to mice: Representative images of mice receiving acetaminophen or saline (control) intraperitoneally, followed by CRET/FRET-SPN (0.8 mg) intravenously. Chemiluminescence (top, imaged 18 min after nanoparticle administration) and fluorescence (bottom, imaged 53 min after nanoparticle administration) channels are shown (n = 3 mice per treatment group). (c&d) Longitudinal, in vivo monitoring of the remediation of APAP-induced hepatotoxicity with the enzyme inhibitors (1-ABT and t-1,2-DCE) and the antioxidant scavenger (GSH). Emission intensities of the liver for chemiluminescence (c) or fluorescence ratiometric (d) signals over times. Black arrows indicate the respective time points shown in b. Values are the mean ± s.d. for n = 3 mice. Reproduced from ref. 60.

