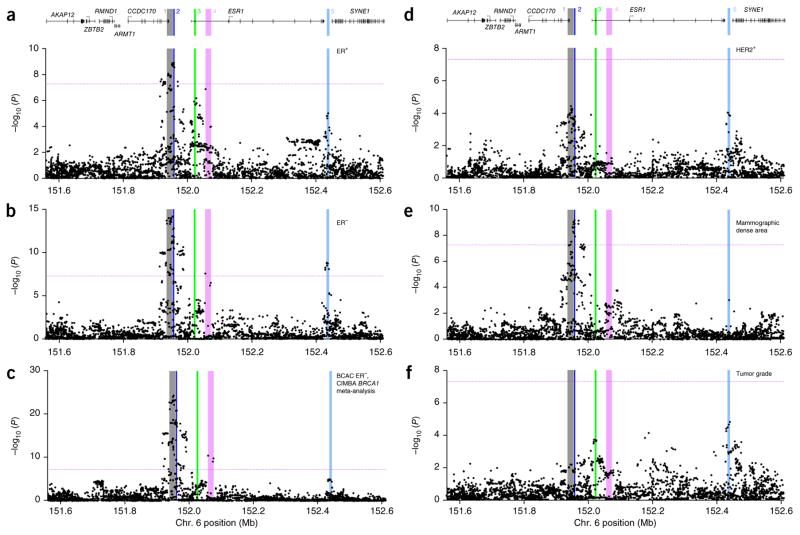
Figure 1.
Association results for all SNPs with six phenotypes. (a–f) The phenotypes analyzed include risk of ER+ breast cancer in BCAC (a), risk of ER− breast cancer in BCAC (b), risk of triple-negative breast cancer, derived from the CIMBA meta-analysis of BRCA1 mutation carriers with ER− tumors (c), risk of HER2+ breast cancer in BCAC (d), mammographic dense area in MODE (e) and tumor grade after adjustment for ER status in BCAC (f). P values for each SNP (from unconditional logistic regression) are shown plotted as the negative log-transformed P value against relative position across the locus. A schematic of the gene structures is shown above a and d. The physical positions of signals 1–5 are shown as colored, numbered stripes. Dotted horizontal lines indicate the genome-wide significance level.

